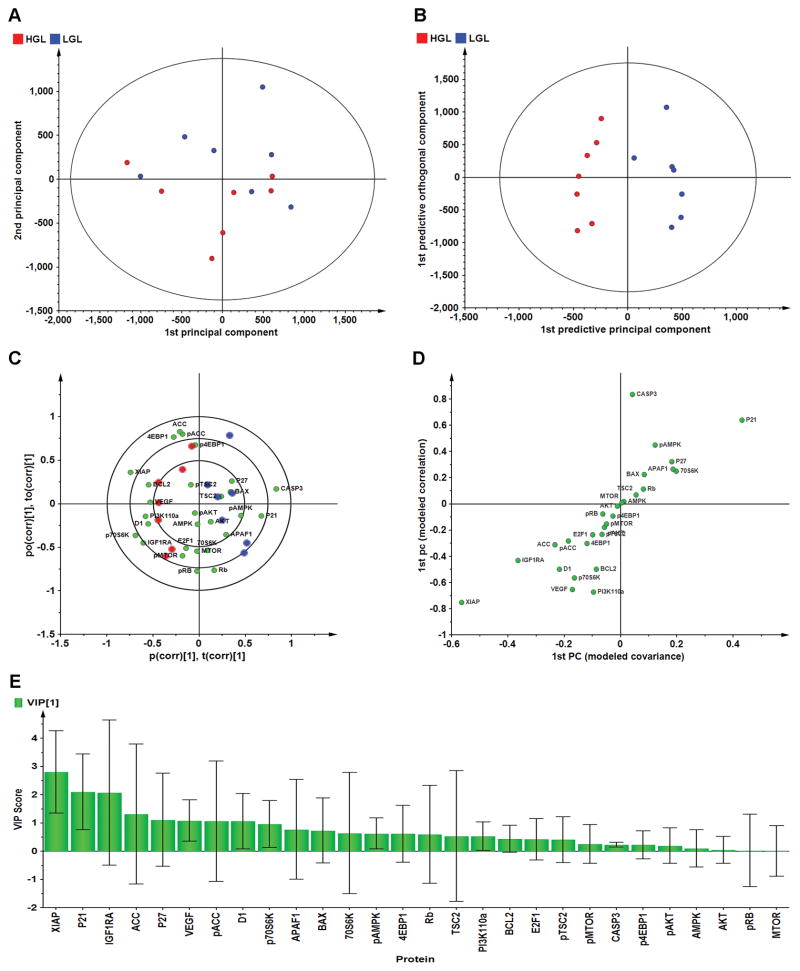
Fig. 4.
Effects of high or low glycemic load human diets on patterns of protein expression in mammary carcinomas. Multivariate discriminant analysis was used to determine whether Western blot data for 26 proteins assessed in mammary carcinomas could distinguish among treat groups. (A) To visualize inherent clustering patterns, the scatter plot represents unsupervised analysis through PCA. Incomplete separation of treatment groups is observed. Model fit: R2X(cum)= 0.747, with 5 components. (B) To determine contributing sources of variation, the scatter plot represents supervised analysis of the 2-class OPLS-DA model, which rotates the model plane to maximize separation due to class assignment. Complete separation of the 2 classes was observed. Model fit: R2Y(cum) = 0.984, Q2Y(cum) = 0.963. (C) To determine the proteins responsible for class separation multivariate analysis was used to construct a biplot that identified influential proteins responsible for the separation between classes. (D) An S-plot was constructed by plotting modeled correlation in the first predictive principal component against modeled correlation from the first predictive component. Upper right and lower left regions of S-plots contain candidate proteins with both high reliability and high magnitude discriminatory proteins (n = 28). (E) To determine the statistical reliability of the proteins shown in (4-D), jack-knifed confidence intervals (JKCI) were created on the magnitude of covariance in the first component for the 28 proteins and sorted in ascending order based on expression in the low glycemic load group; proteins with JKCI including 0 were considered not to account for separation.

