
Table 3.
Structural modification at Site C
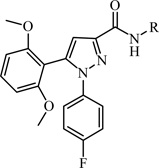 | |||
|---|---|---|---|
| Compd. | R | EC50
* (µM) ±SEM |
Ki * (µM)± SEM |
| 16 |  |
>30 | |
| 17 |  |
>30 | |
| 18 |  |
>30 | |
| 19 |  |
>30 | |
| 20 |  |
9.4 ± 3.4 | 0.6 ± 0.10 |
| 21 | 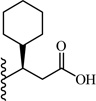 |
9.9 ± 2.6 | 1.4 ± 0.2 |
| 22 | 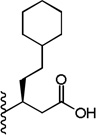 |
0.8 ± 0.1 | 1.3 ± 0.3 |
| 23 |  |
>30 | |
| 24 | 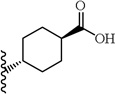 |
>30 | |
| 25 | 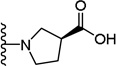 |
>30 | |
| 26 |  |
>30 | |
| 27 |  |
>30 | |
| 28 |  |
>30 | |
| 29 |  |
>30 | |
| 30 |  |
>30 | |
| 31 |  |
3 ± 0.2 | 3 ± 0.6 |
*
EC50 and Ki values are averages of multiple experiments (where n = 3, unless otherwise stated) ± standard error of the mean.