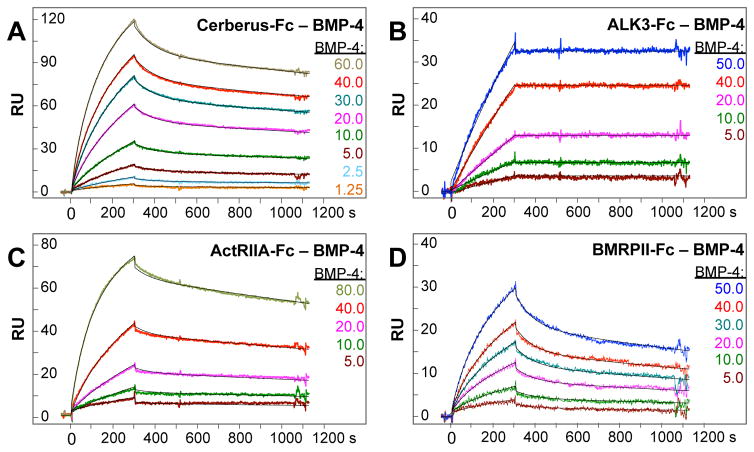
Figure 1. BMP-4 binding to Cerberus and receptors.
(A) BMP-4 – Cer-Fc interaction. Cer-Fc was captured on the sensor chip and different concentrations of BMP-4 as shown were injected. (B) BMP-4 – ALK3-Fc interaction. ALK3-Fc was captured on the sensor chip and different concentrations of BMP-4 as shown were injected. (C) BMP-4 –ActRIIA-Fc interaction. ActRIIA-Fc was captured on the sensor chip and different concentrations of BMP-4 as shown were injected. (D) BMP-4 –BMPRII-Fc interaction. BMPRII-Fc was captured on the sensor chip and different concentrations of BMP-4 as shown were injected. (A–D) Colors of injection curves are matches with corresponding concentrations. Fitted curves (black lines) are superimposed over all experimental curves. Calculated binding rate constants and equilibrium dissociation rate constants are shown in Table 1.

