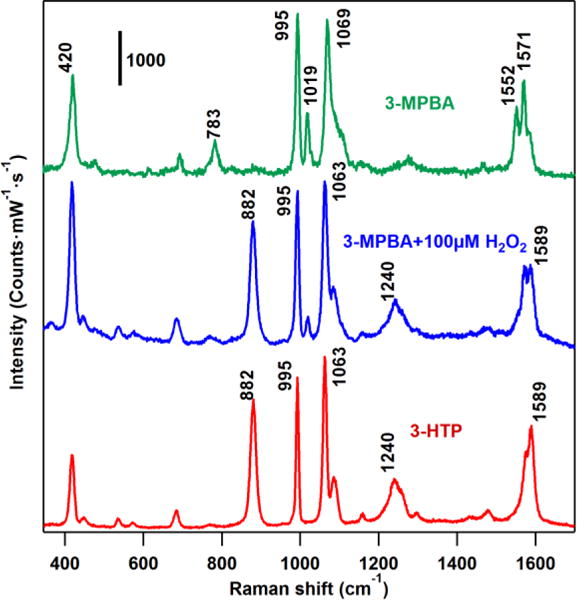
Figure 2.

SERS spectra of 3-HTP, 3-MPBA and 3-MPBA treated with 100 μM H2O2. All of the Au colloids samples were aggregated by 1 M NaBr solution before measurement. (λex = 785 nm, Plaser = 500 μW, t = 10 s). The SERS spectra (blue trace) of the H2O2 treated nanoprobe exhibits different spectra from the untreated samples (3-MPBA, green trace) and is almost identical to the spectra of the oxidized product (3-HTP, red trace).
