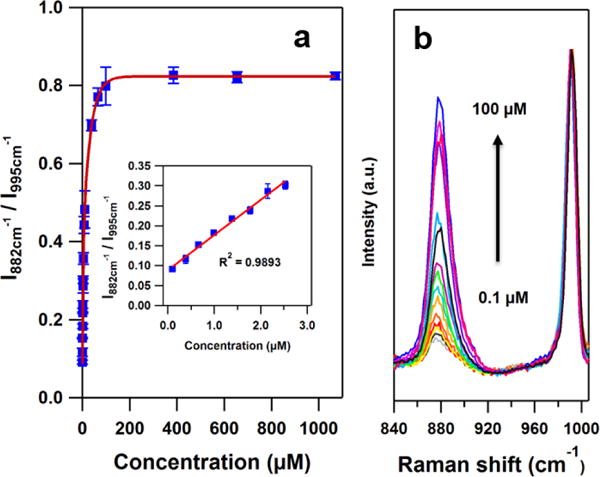
Figure 3.

(a) The SERS response of the boronate nanoprobe in PBS as obtained from the intensity ratio of the bands at 882 cm−1 and 995 cm−1 as a function of the H2O2 concentration. Inset: A linear response is obtained for H2O2 concentrations between 0 and 3.0 μM. The error bars represent the relative standard deviations (RSD) from 3 replicate samples each of which was measured at 7 different spots. (λex = 785 nm, Plaser = 500 μW, t = 10 s) (b) The average SERS spectra of the boronate nanoprobe in the presence of 0.1 μM to 100 μM H2O2.
