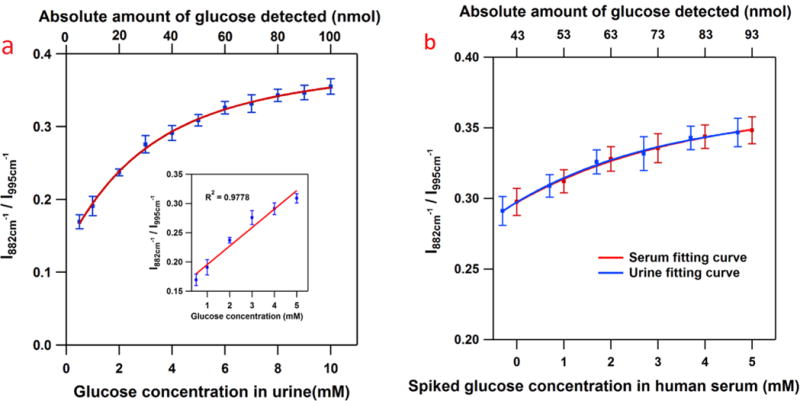
Figure 6.

(a) The SERS response obtained from the boronate modified nanoprobe to the addition of 10 μL of glucose spiked urine solutions (bottom axis). The absolute amount in nmol of glucose detected is given for comparison (top axis). Inset: The probe displays a linear response range over the biologically relevant concentration range (0.5 mM to 5 mM). (b) The SERS response obtained from the boronate modified nanoprobe to the addition of 10 μL of glucose spiked human serum solutions (bottom axis). The absolute amount in nmol of glucose detected is given for comparison (top axis). The red trace is the curve fitting from human serum samples. For comparison, we also show the curve fitting from artificial urine samples (blue trace) in the same range of absolute amount of glucose present in the samples. The error bars in both graphs represent the relative standard deviations (RSD) from 3 replicate samples, each of which was measured at 7 different spots. (λex = 785 nm, Plaser = 500 μW, t = 10 s)
