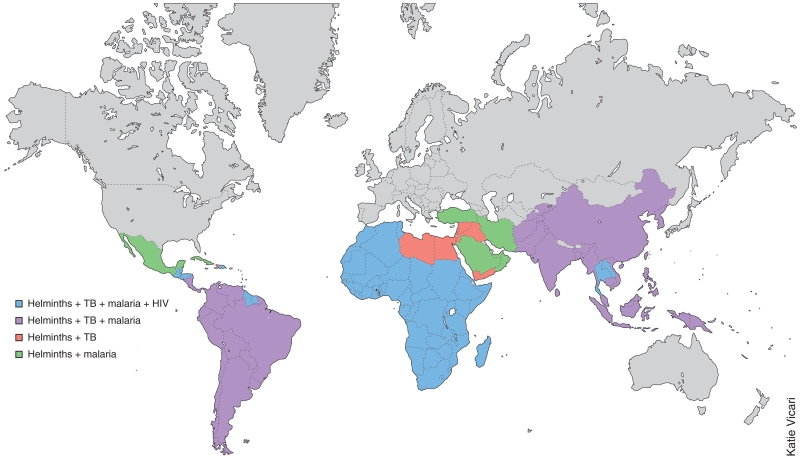
Figure 1.
World map showing the geographic distribution of coinfection with helminths together with tuberculosis, malaria and/or HIV infection of adults. This simplified map (constructed for illustrative purposes) includes only data obtained from the following sources: for helminths, lymphatic filariasis, onchocerciasis, schistosomiasis or soil-transmitted helminthiasis123; for tuberculosis (TB), incidence rates124; for malaria, the countries and territories affected125; and for HIV, the reported prevalence in adults126. Countries with fewer than 25–49 new cases of tuberculosis per 100,000 people and with a prevalence of HIV infection below 0.5% have not been included here. Because of that cutoff for HIV, many parts of the world (such as India and South America) are not presented here as regions with coinfection with helminths and HIV, although there is a substantial HIV burden in those countries.

