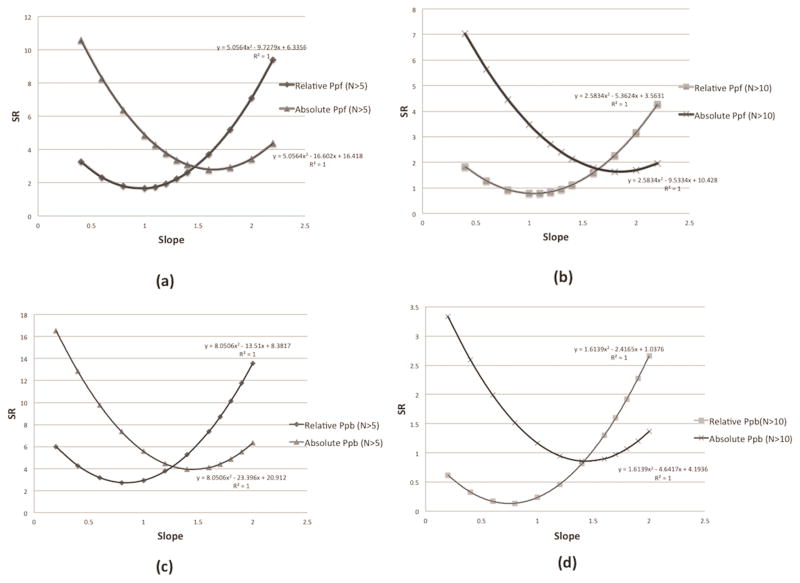
Figure 3.
(a) The SR calculation of (using optimal fthreshold value) and (using 1kcal/mol threshold) when taking N>5. (b) The SR calculation of (using optimal fthreshold value) and (using 1kcal/mol threshold) when taking N>10. (c) The SR calculation of (using optimal fthreshold value) and (using 1kcal/mol threshold) when taking N>5. (d) The SR calculation of (using optimal fthreshold value) and (using 1kcal/mol threshold) when taking N>10. N>5 and N>10 means only the SAVs, which are observed at least five or ten times in the datasets, will be used for SR calculation.

