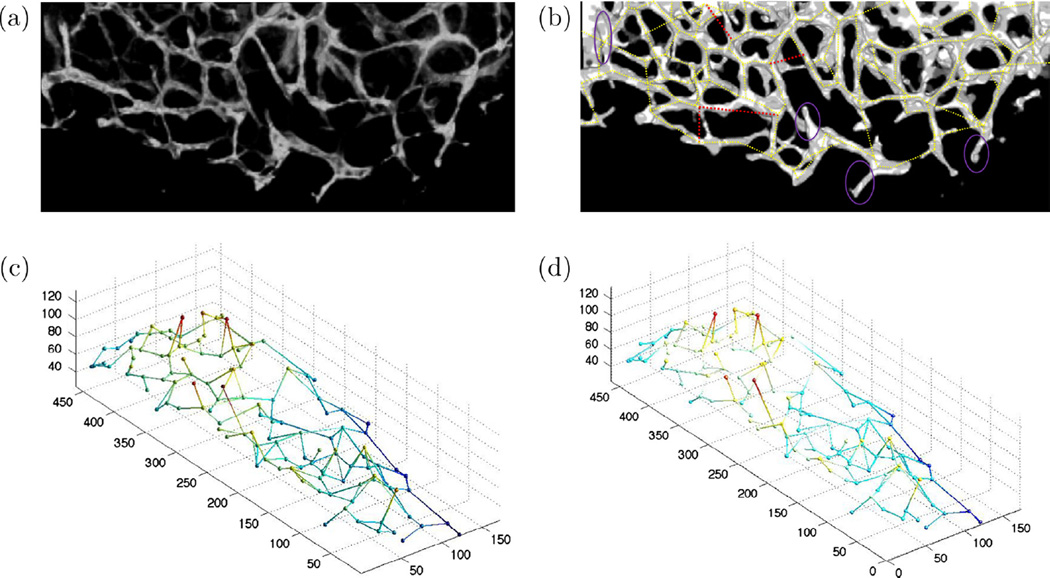
Fig. 14.
(a) Maximum intensity projection of dataset 1, a real 3-D fluorescence microscopy image of murine cortical microvasculature, (b) enhanced binary image with illustration of the situations where graph extraction method fails to capture the correct structure. Purple ellipses identify vessels that are missed in the graph, and red edges are topologically correct but their locations are offset on one end, (c) ground truth 3-D graph model, and (d) extracted 3-D graph-based model. (For interpretation of the references to color in this figure legend, the reader is referred to the web version of this article.)

