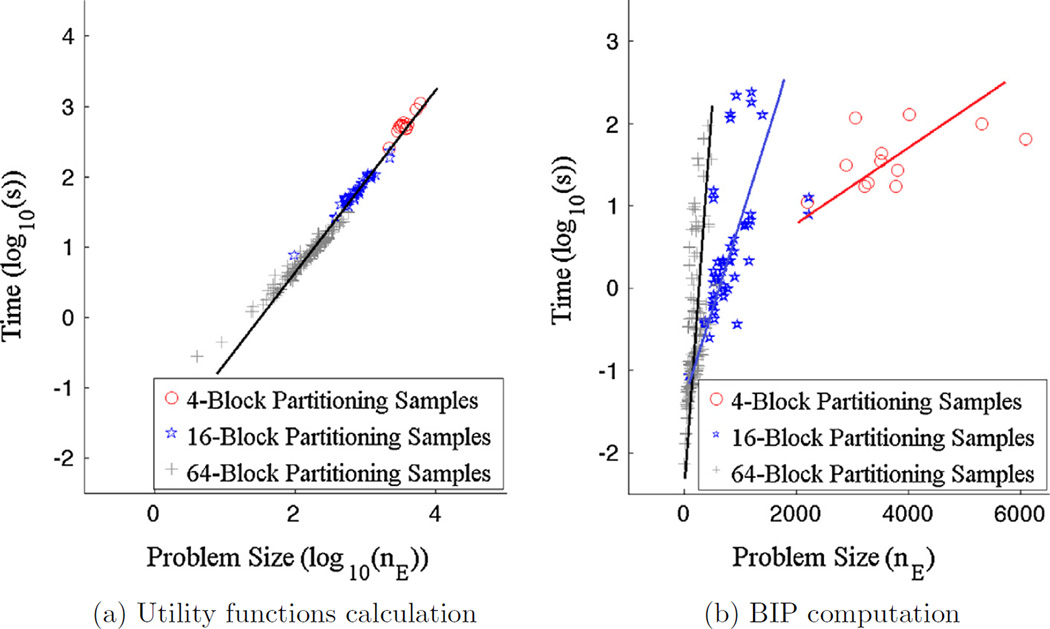
Fig. 19.
Logarithm of the computation time for all 192 + 48 + 12 = 252 blocks obtained from 4-block, 16-block, and 64-block partitioning and three different tessellations for (a) utility functions calculation and (b) BIP computation. A log–log plot is presented in (a) where the line indicates complexity rises linearly with problem size for this calculation. A log-linear plot is provided in (b) where the linear structures indicate an exponential nature of the BIP complexity that depends in the scale at which the problem is decomposed.

