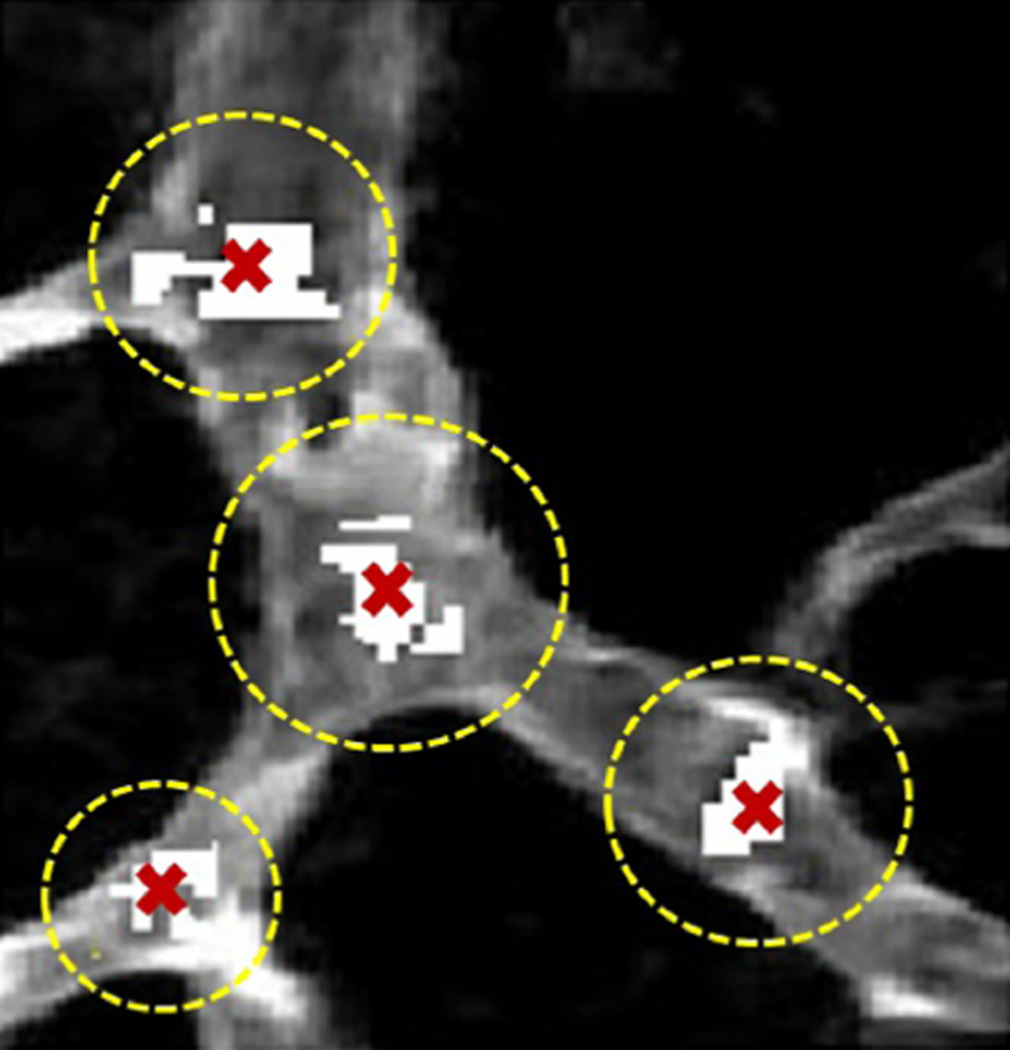
Fig. 6.
Detected critical point patches are shown by white pixels overlaid on MIP of a real data. In three out of the four cases we see multiple, disconnected patches that are clearly associated with the same CP. Agglomerative clustering provides a single representation of these patches as the CP shown by a cross mark.

