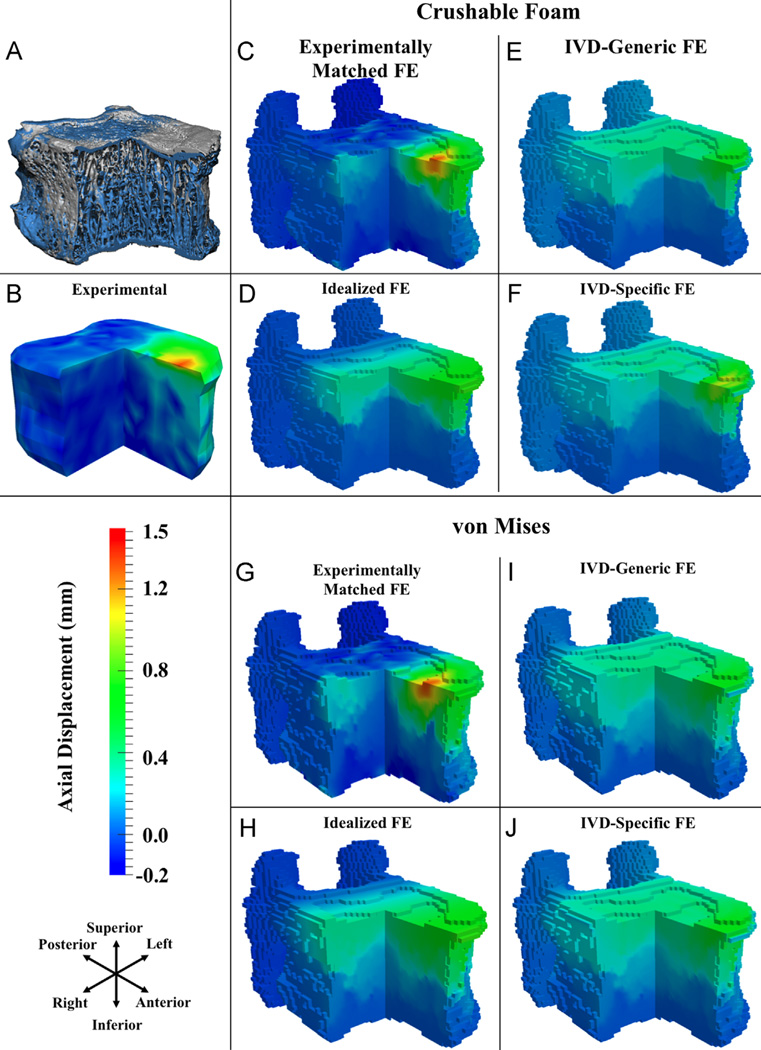
Fig. 4.
For flexion: (A) three-quarter section view of a representative T8 vertebral body before loading (gray) and at the load increment following peak of loading (blue); (B–J) three-quarter section views of measured and FE-computed axial displacements (positive values are downward displacements) at the load increment following peak of loading, for CF (C–F) and VM (G–J) yield criteria. (For interpretation of the references to color in this figure legend, the reader is referred to the web version of this article.)

