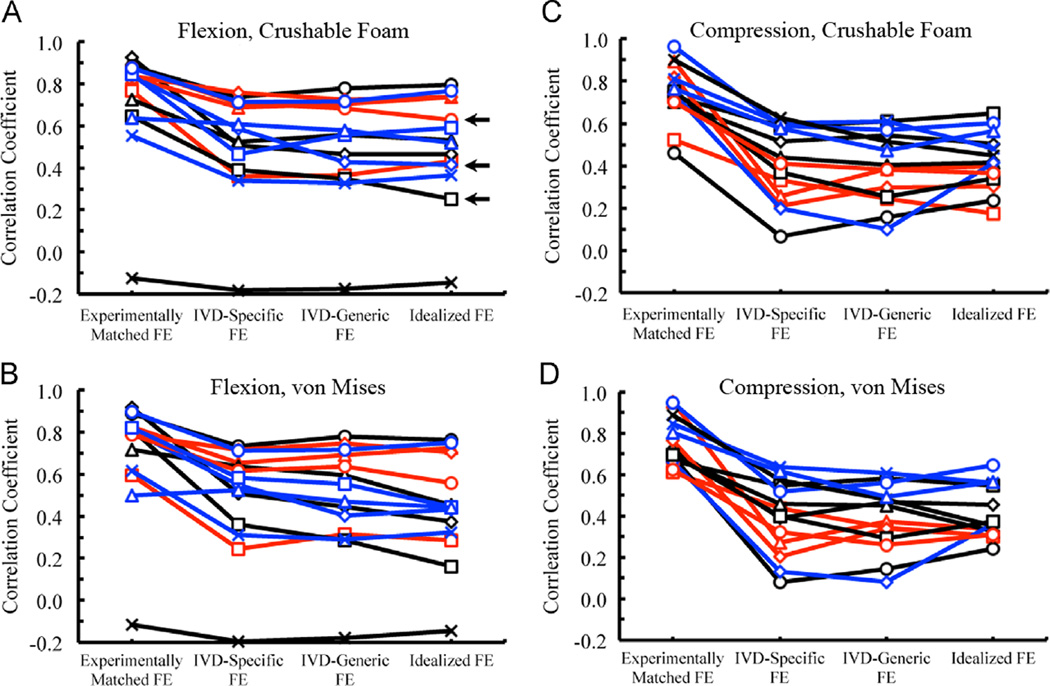
Fig. 6.
Pearson correlation coefficients for the correlations between FE-computed and measured displacements for all four boundary conditions using CF and VM yield criteria, for both flexion and compression loading; in all four plots, the line color corresponds to the ALDI score of the T7/8 IVD (blue = 0, black = 1, red = 2), and for a given ALDI score each specimen is indicated with a different symbol. The three specimens used for the scatterplots in Fig. 3 are denoted with a horizontal black arrow. (For interpretation of the references to color in this figure legend, the reader is referred to the web version of this article.)

