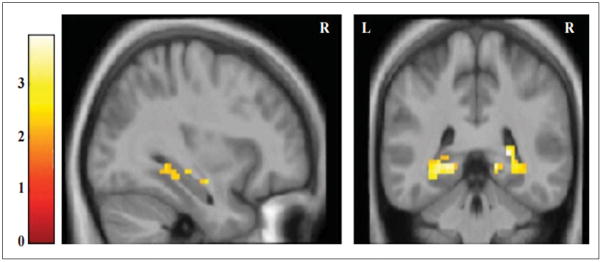
Figure 2. PSEN1 carriers show greater MTL activity during successful encoding of complex scenes than non-carriers.
A priori region-of-interest analysis during successful encoding. Statistical Parametric Maps (SPMs) for the comparison PSEN1 mutation carriers vs noncarriers for the contrast remembered vs forgotten scenes. Functional images are displayed on anatomical images derived from an average obtained from the normalized structural images of all subjects using an anatomical mask of the combined bilateral hippocampal formation and parahippocampal gyri with a statistical threshold of p < 0.005 uncorrected (extent threshold 5 voxels). MNI coordinates for peak activated voxel: [x,y,z][33, −40, −8]. Color bar represents t values for all activated voxels within the anatomical mask.

