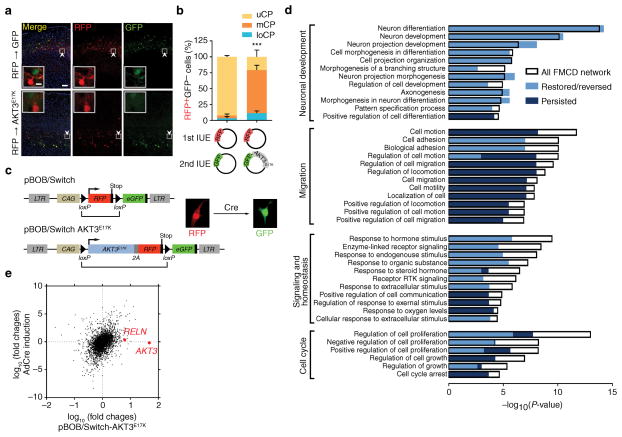
Figure 5. Genetic recombination of AKT3E17K defines reversibility of FMCD networks.
(a) In utero electroporation at E14.5 of RFP vector, followed by second electroporation after 15 min of GFP-alone (n = 5) or GFP along with AKT3E17K (n = 3) harvested at P14. Insets: singularity of plasmid expression. (b) Quantified localization of RFP+GFP− cells. (c) pBOB/Switch vectors, empty (top) or with AKT3E17K linked (bottom). RFP expressed from a bicistronic 2A sequence, allowing stoichiometric RFP and AKT3E17K expression. LTR, long terminal repeat; CAG, chicken actin promoter. RFP-expression cassette with stop codon is removed upon Cre recombination with adenoviral transduction (bracket), providing color switch from RFP to GFP. (d) GO analysis identified four major enriched categories (Neuronal development, Migration, Signaling and homeostasis, and Cell cycle), and several subcategories as indicated. P-values for GO enrichment for each subcategory are shown (x-axis). Colors indicate P-values of the GO enrichment for the portion of the genes within each subcategory that persisted (dark blue), or were restored (from high to background or from low to background, light blue) or reversed (from high to low or from low to high, light blue), overlaid on each subcategory. (e) Comparison of mRNA abundance after AKT3E17K overexpression (x-axis) vs. genetic removal of AKT3E17K by Cre recombination (y-axis). Note that the expression of AKT3 and RELN were initially elevated with AKT3E17K overexpression but were restored upon Cre recombination. Values: mean ± s.d. ***, P < 0.001, G-test of goodness-of-fit (b); Scale bars: 100 μm (a); 10 μm (inset in a).

