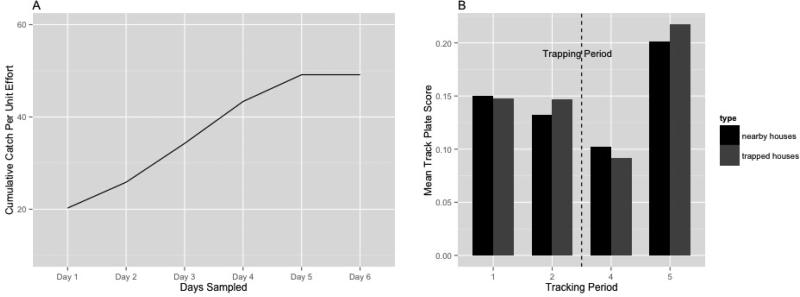
Fig. 4.
Figures of rats captured at the two-trapped households (both traps and plates set: panel 2A) and the mean track plate scores for the trapped and the nearby households (only plates) households are similar, indicating that the presence of traps did not influence subsequent rat activity/abundance. A) Data for rats trapped during period 3 (excluded for clarity from panel B), after baseline track plate sampling (periods 1 & 2: Figure 2B), show an asymptotic curve based on the Catch Per Unit Effort function, suggesting the population was exhausted. The mean level of rat activity declined significantly immediately after trapping (period 4) but rebounded 4 weeks after the trapping (period 5) for both experimental and control groups.

