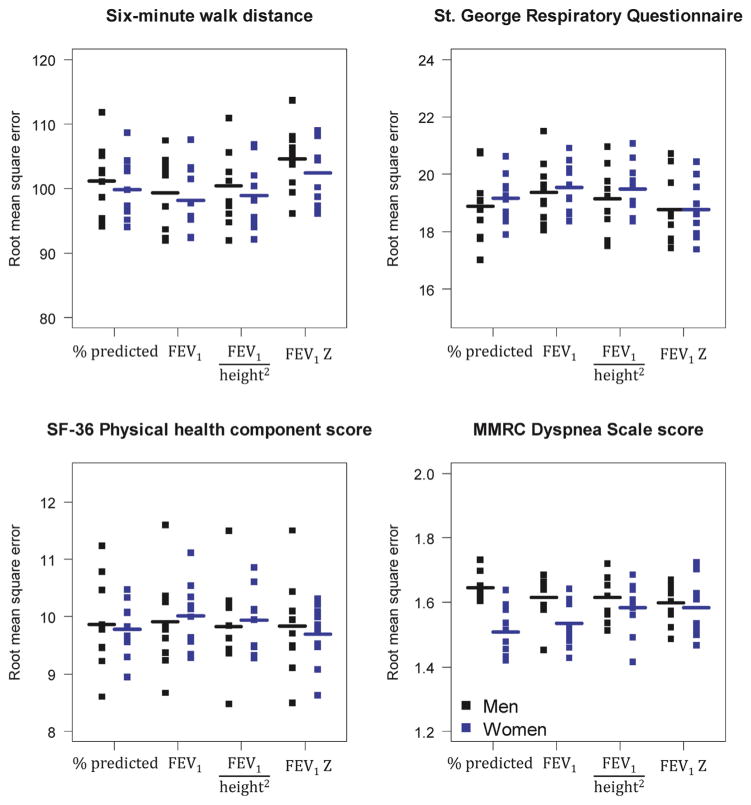
Fig. 4.
Distribution of the 10-fold square root expected prediction errors for six-minute walk distance, St. George Respiratory Symptoms Questionnaire Score, SF-36 physical health component score, and the MMRC Dyspnea Scale Score by severity classification criteria for ventilatory impairment stratified by sex. The red horizontal lines represent the root mean squared errors.

