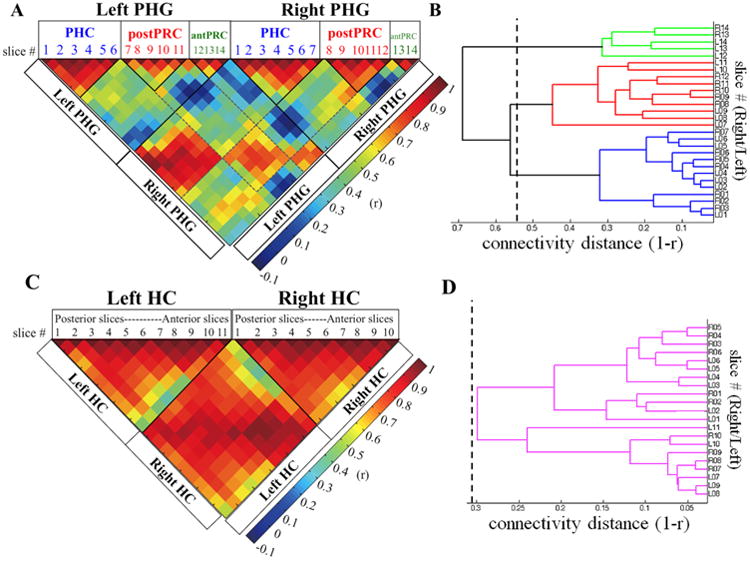
Figure 2. Connectivity homogeneity matrices and dendrograms for the HC and PHG.

A) and C) are the connectivity homogeneity matrices for the PHG and HC. The entries for each column/row in the matrix are connectivity similarity values (r) between a given slice and all other slices in the PHG or HC. Solid lines indicate significant clusters identified in the dendrogram and dashed lines show the connectivity similarity for homologous clusters across left and right hemisphere. B) and D) are dendrograms for the PHG and HC. The x-axis is “connectivity distance” (1-r). The y-axis is number of the coronal slice, which indicates the physical location of a given slice in a brain region. The numbers correspond to column/row number labeled on the connectivity homogeneity matrix. L stands for left hemisphere and R stands for right hemisphere. The dashed lines on the dendrograms represent the connectivity distance threshold. Clusters to the right of the threshold are the significant clusters, highlighted in different colors (PHC: blue, postPRC: red, antPRC: green, HC: purple). A) The PHG connectivity homogeneity matrix. In the matrix, the first 14 columns/rows contain the connectivity similarity values for each of the left PHG coronal slice. The connectivity similarity values for right PHG coronal slices start from the 15th column/row. Three clusters were identified in the PHG: PHC (blue), postPRC (red), and antPRC (green). Boxes above the matrix contain slice numbers, which are separated into three clusters accordingly. B) The PHG dendrogram, showing the hierarchical relationships among coronal slices based on their connectivity distance. The dashed line on the dendrogram represents the connectivity distance threshold for the PHG (1-r = 0.5572, p< .05). Clusters to the right of the distance threshold are the three significant clusters: PHC (blue), postPRC (red), and antPRC (green). C) HC connectivity homogeneity matrix. In the matrix, the first 11 columns/rows are left HC coronal slices arranging from posterior to anterior along the long axis. The right HC coronal slices start at the 12th column/row and end at the 21st column/row. D) The HC dendrogram. The dashed line on the dendrogram represents the connectivity distance threshold for the HC (1-r = 0.3444, p< .05).
