
Figure 6. The MTL and whole-brain connectivity for the HC.
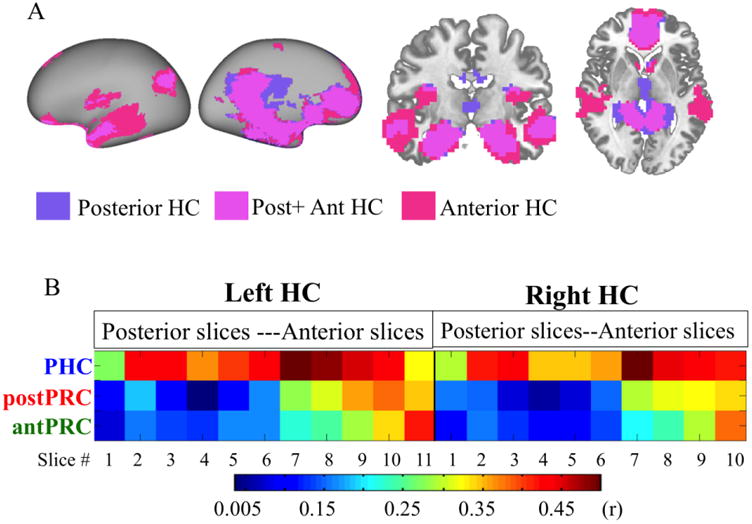
A ) Networks connected with the anterior and posterior HC. A one-sample t-test was conducted to identify voxels that showed suprathreshold FC values associated with different anterior (pink) and posterior (purple) HC (voxel-wise p<.001, cluster-corrected p<.05). Voxels significantly connected with both anterior and posterior HC are in magenta. B) FC between the three PHG clusters and the HC coronal slices. Entries in the matrix are FC values (r). Rows represent each of the three clusters in the PHG (PHC, postPRC, and antPRC). Columns represent each of the coronal slices in the left and right HC ranging from posterior to anterior.