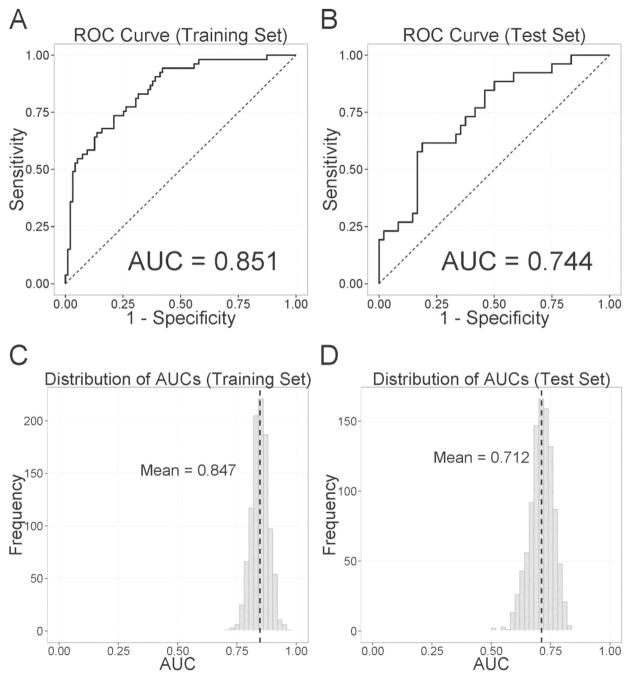
Figure 3.
Classification accuracy of past amphetamine dependence as indexed by the Receiver-Operating-Characteristic (ROC) curves and their area under the curve (AUC) of (A) the training set and (B) the test set. Panels C and D represent the histograms of AUCs when we randomly selected training and test sets 1,000 times. Dashed black lines indicate the mean values of histograms.

