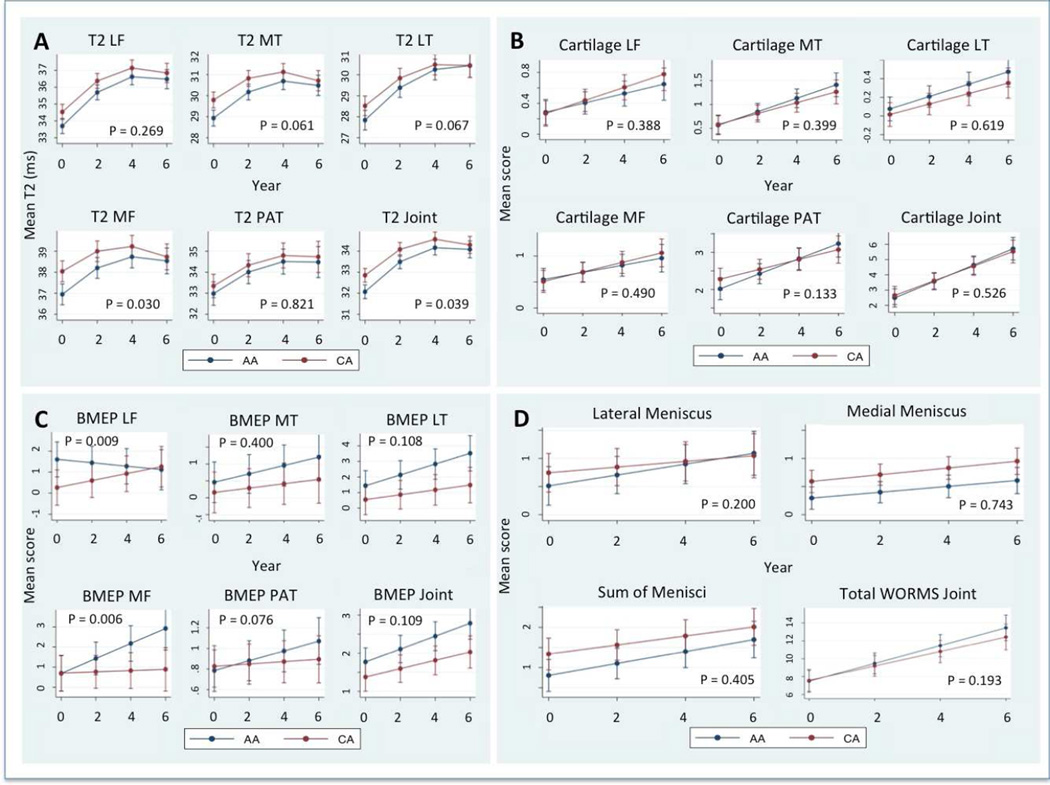
Figure 2.
Mean Cartilage T2 (A) and the WORMS scores for cartilage (B), bone marrow edema pattern (C) menisci (D) and the sum of all WORMS scores (D) in African American (AA) and Caucasian American women (CA) over 6 years. Values are least square means adjusted for multiple measurements per ID and matched pairing between groups pairs using a mixed random effects model. Error bars indicate standard errors. P values indicate significance of differences of the rate of change (at baseline in non linear increments). LF = lateral femur, MF = medial femur, LT = lateral tibia, MT = medial tibia, PAT = patella, Joint = mean of all compatments.

