
Figure 2.
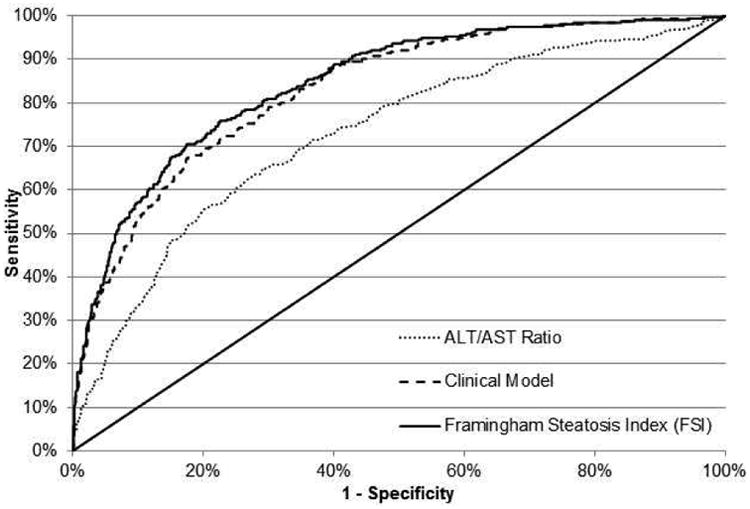
(a) Receiver-operating characteristic (ROC) curves for models predicting hepatic steatosis in the FHS (derivation cohort) from the ALT/AST ratio alone (dot), the Clinical Model (dash) and the Framingham Steatosis Index (solid). For the ALT/AST ratio (dot), the area under the ROC curve was 0.728. At a cut off value of 1.33, sensitivity and specificity were 55% and 80% respectively. The Clinical Model (dash) had an area under the ROC curve of 0.830. The FSI (solid) had an area under the ROC curve of 0.845.
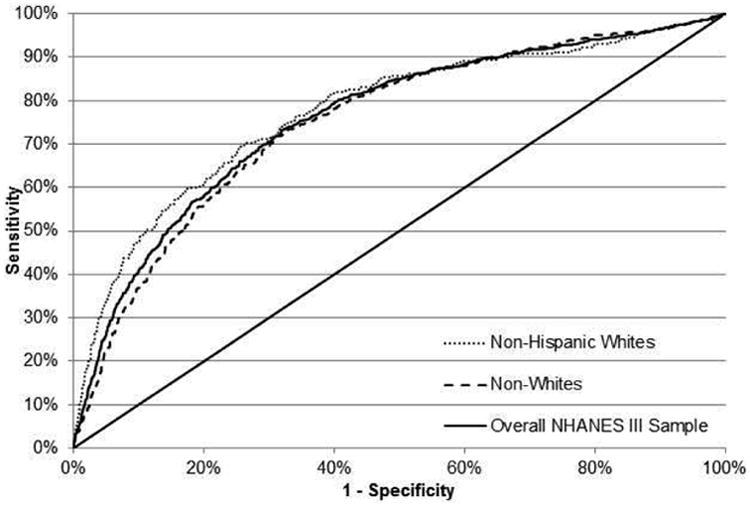
(b) ROC curve for the FSI for the detection of hepatic steatosis in the NHANES III cohort (validation cohort) in the overall NHANES III sample (solid), among non-Hispanic White NHANES III participants (dot) and among non-White NHANES III participants (dash).