
Figure 3. Differential expression levels in the CF enhancement pattern compare to the CP.
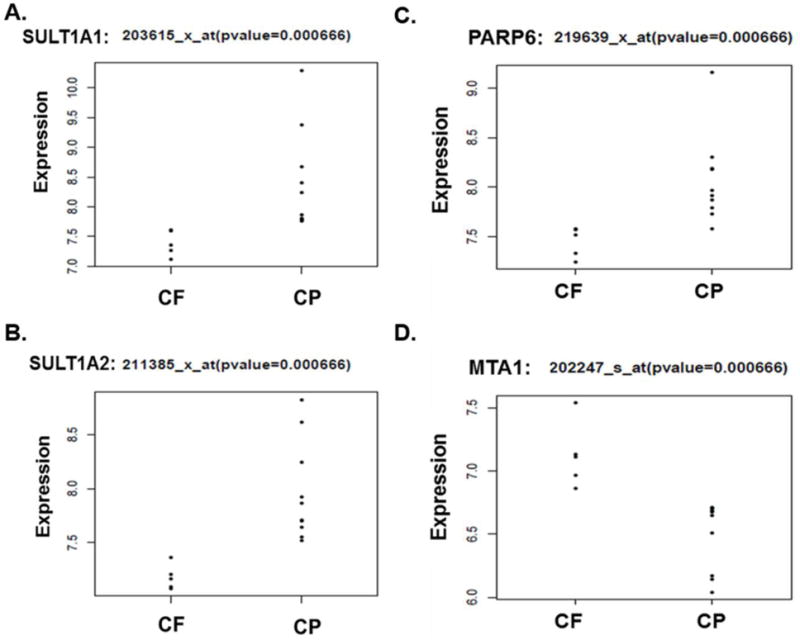
A–B) Our analysis demonstrates an over expression of SULTs (SULT1A1 and SULT1A2) in the CP enhancement compare to CF. C) The CP enhancement pattern is associated with higher expression levels of PARP6. D) MTA1 shows higher expression levels in the CF enhancement pattern compared to the CP.