
Figure 5. External confirmation for gene expression patterns and overall survival in LABC using TCGA database.
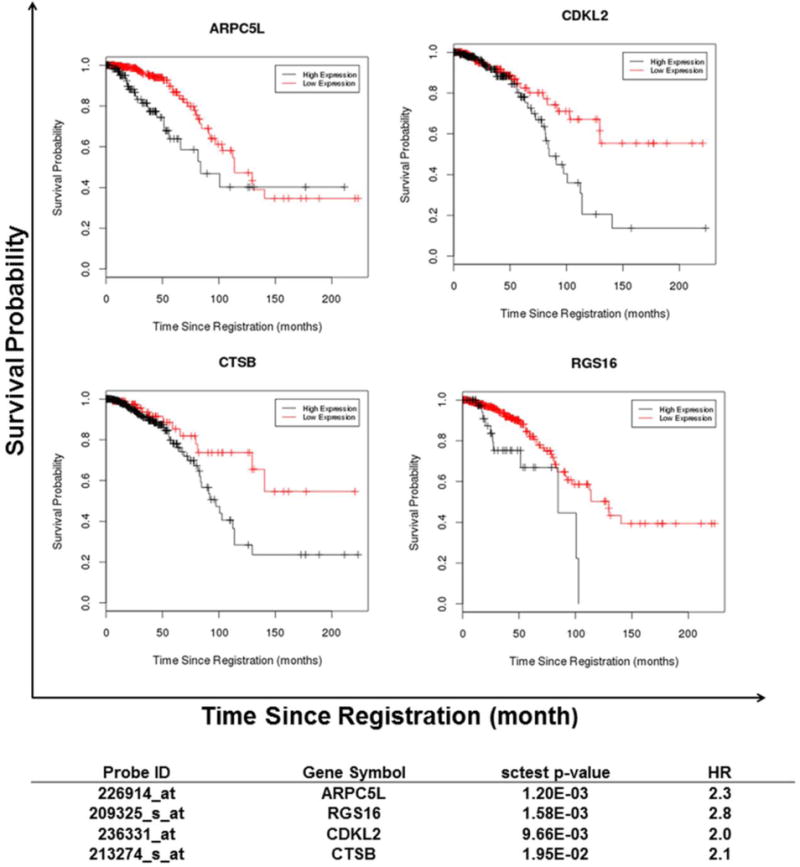
In TCGA LABC cohort differential expression of four genes exhibited the same significant concordance and association with overall survival as in the IBC patients. The black lines in the graph represent high expression levels and the red lines represent low expression levels of the genes. The “sctest p-value” and “HR” (which is a cox HR) columns are based on the log rank test.