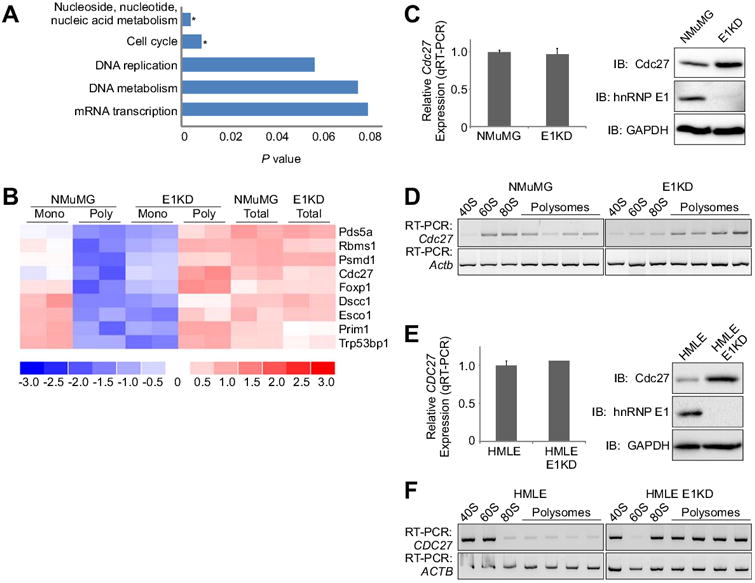
Figure 1. HnRNP E1 regulates translation of mRNAs involved in many biological processes.

(A) DAVID analysis of translationally regulated genes identified in Affymetrix array of monosomal NMuMG genes and polysomal E1KD genes, with results given as P values (Student's t Test, fold change > 1.5 between groups and < 1.5 within groups; * P < 0.5 were considered statistically significant). Genes were annotated using Panther biological processes. (B) Heat map showing differential signal strength intensities for cell cycle genes between NMuMG and E1KD monosomes and polysomes compared to total, unfractionated mRNA. (C) Left Total RNA isolated from NMuMG and E1KD cells were subjected to qPCR analysis to assess steady state Cdc27 mRNA expression levels normalized to Actb (control). Data are presented as means ± s.e.m., n=3. Right Immunoblot analysis examining protein expression levels of Cdc27, hnRNP E1, and GAPDH (control) in whole cell lysates isolated from asynchronous NMuMG and E1KD cells. (D) Semi-quantitative RT-PCR using gene specific primers to Cdc27 (30 cycles) and Actb (21 cycles; control) on RNA isolated from polysome profiles of asynchronous NMuMG and E1KD cells. (E) Total RNA isolated from HMLE and HMLE-E1KD cells were subjected to qPCR analysis to assess steady state Cdc27 mRNA expression levels normalized to Actb (control). Data are presented as means ± s.e.m., n=3. Right Immunoblot analysis examining protein expression levels of Cdc27, hnRNP E1, and GAPDH (control) in whole cell lysates isolated from asynchronous HMLE and HMLE-E1KD cells. (F) Semi-quantitative RT-PCR using gene specific primers to Cdc27 (32 cycles) and Actb (23 cycles; control) on RNA isolated from polysome profiles of asynchronous HMLE and HMLE-E1KD cells.
