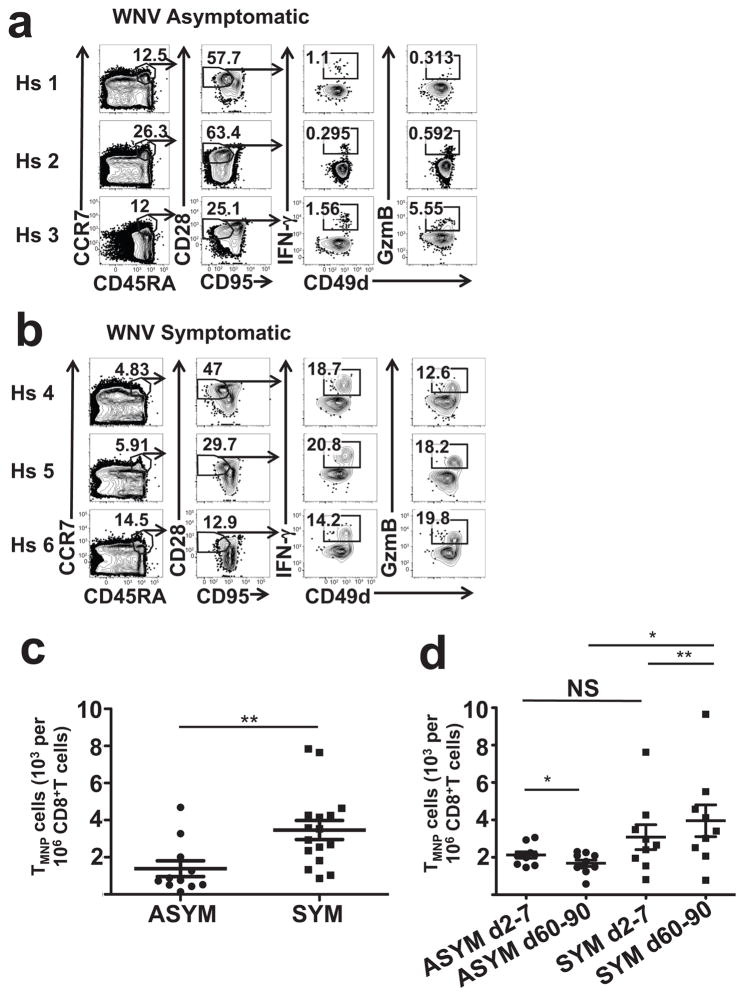
Figure 8. Individuals with symptomatic WNV infection show increased levels of TMNP cells.
a,b. Intracellular IFN-γ and GzmB staining of human PMA+iono- activated PBMCs from six representative WNV+ donors (three WNV asymptomatic (a) and three WNV symptomatic (b)). Dot plots show gating strategy to quantify TMNP (IFNγ+CD45RA+ CCR7+CD95loCD28int) CD8+ T cells (shown as percentages of the population within each gate after subsequent gating and quantified as number (mean ±SEM) of TMNP cells per million CD8+ T cells (c) (Mann-Whitney test, **p<0.01, n=26). Data are representative of one experiment). d. Quantification of TMNP CD8+ T cells (number (mean ±SEM) of TMNP (IFNγ+CCR7+CD45RA+CD95loCD28int) cells per million CD8+ T cells) from individuals with asymptomatic and symptomatic WNV infections early (day 2–7) and late (day 60–90) after index donation (Repeated measures ANOVA was used to compare symptomatic group to asymptomatic group at two time points. Prior to applying repeated measures, equal variance assumption was tested by Levene’s test. The heterogeneous Compound Symmetry covariance structure was used to not only account for the within subject correlation but also adjust for the variance heterogeneity. p=NS, *p<0.05, **p<0.01,(asymptomatic n=11, 39–92y old; symptomatic n=16, 43–84y). Data are representative of one experiment.

