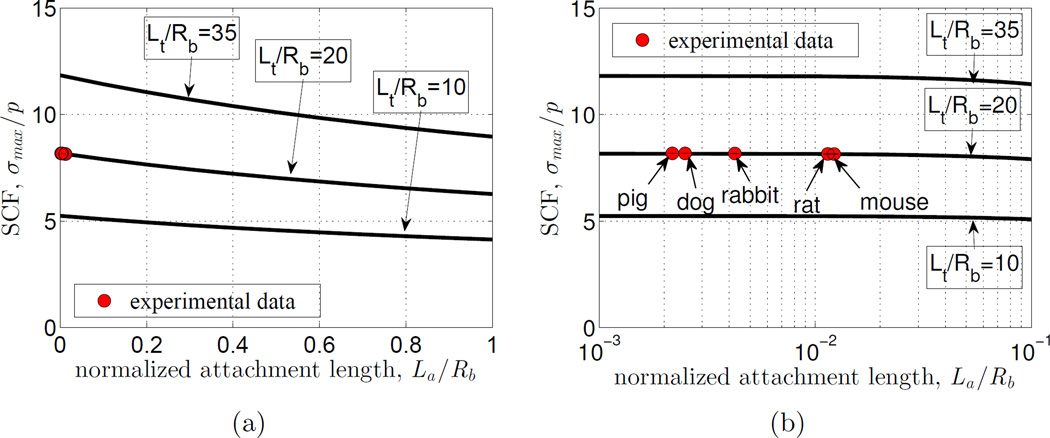
Figure 4.
(a) The stress concentration factor (SCF) varied substantially with the normalized gradient size (La/Rb) for all various ratio of Lt/Rb = 10, 20, 35. (b) However, in the two decades of the physiological range, this variation was only a few percent. In both figures, Red circles are data for animals ranging from mice to pigs at a constant normalized tendon length Lt/Rb = 20. Note that error bars are too narrow to be seen relative to the red circles.

