Fig 5.
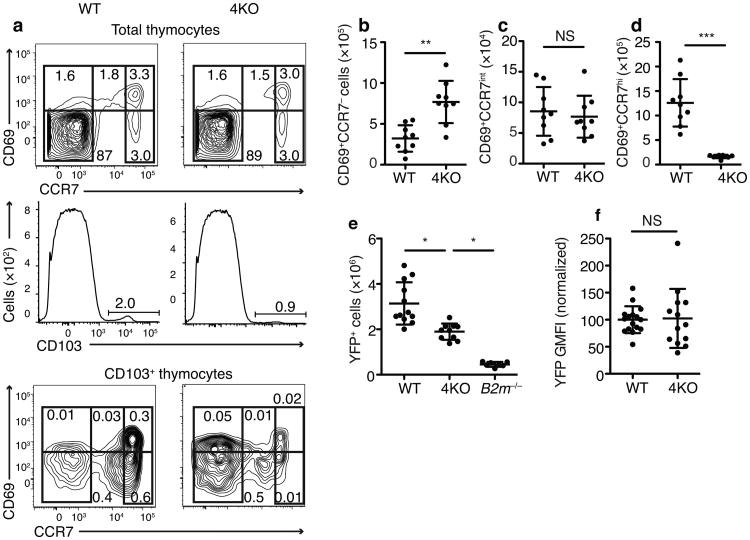
Expression of CCR7 and markers of CD8 lineage commitment on 4KO thymocytes Flow cytometric plots (a) and quantitation of (b) CD103+CD69+CCR7–, (c) CD103+CD69+CCR7int, or (d) CD103+CD69+CCR7hi thymocytes. (n=9 mice per group, male and female, combined from 3 experiments.) (e) Number of YFP+ thymocytes in Runx3dYFP/+→WT, Runx3dYFP/+→4KO, or Runx3dYFP/+→B2m−/− chimeras and (f) YFP GMFI on CD69+TCRβintCD103+ cells. Mean of wild-type BM recipient results set to 100% in each experiment. (n=12 wild-type, 10 4KO, 7 B2m−/− combined from 2 experiments). Numbers on gates indicate percent of total thymocytes (a). NS, not significant, **P=0.0005 ***P<0.0001 in b-d, and f, (Student's t-test) or *P<0.05 in e, (One-way ANOVA with Dunnett's multiple comparison post-test). b-f (mean±SD).

