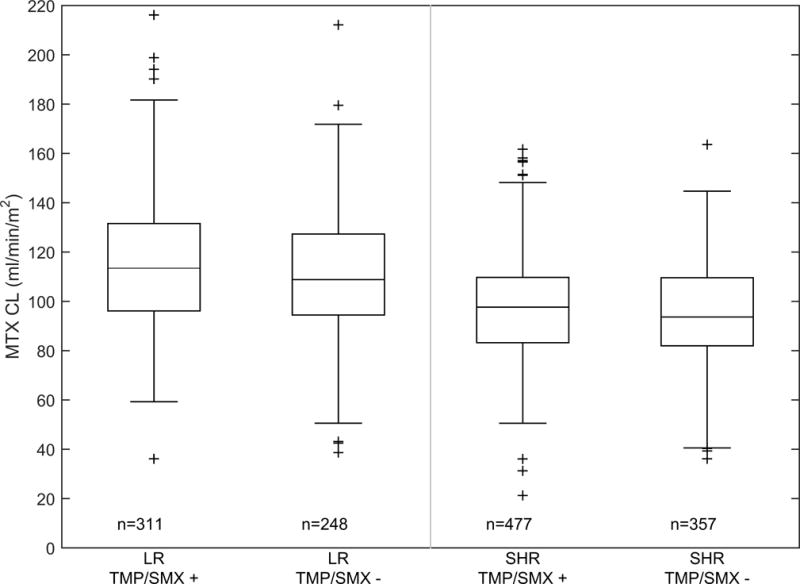
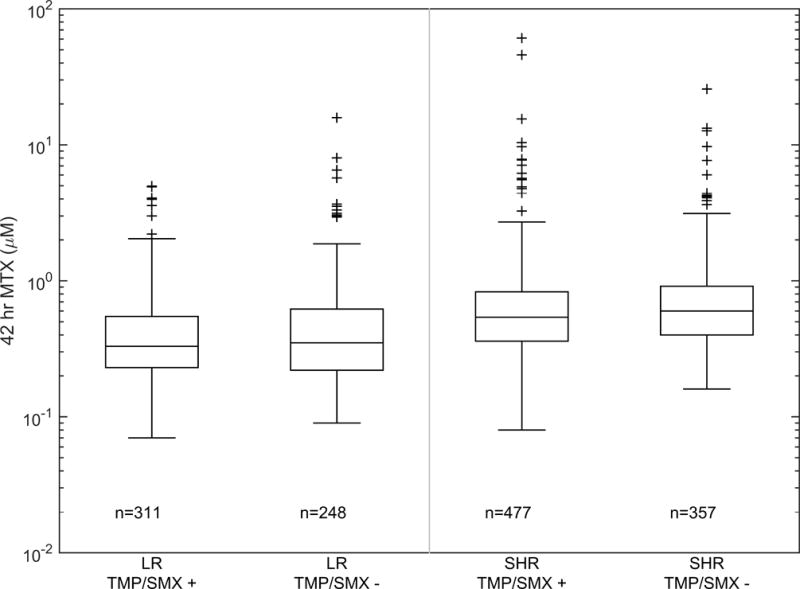
Figure 1. MTX clearance and 42 hr exposure subdivided by risk group and TMP/SMX status.


(A) Boxplot of individual methotrexate clearance estimates subdivided by risk group and TMP/SMX status. The bar, box, and whiskers represent the median, 25th–75th percentile, and non-outlier range respectively. n is the number of courses in each group. (B) Boxplot of individual methotrexate 42 hour plasma concentration subdivided by risk group and TMP/SMX status. The bar, box, and whiskers represent the median, 25th-75th percentile, and non-outlier range respectively. n is the number of courses in each group.
