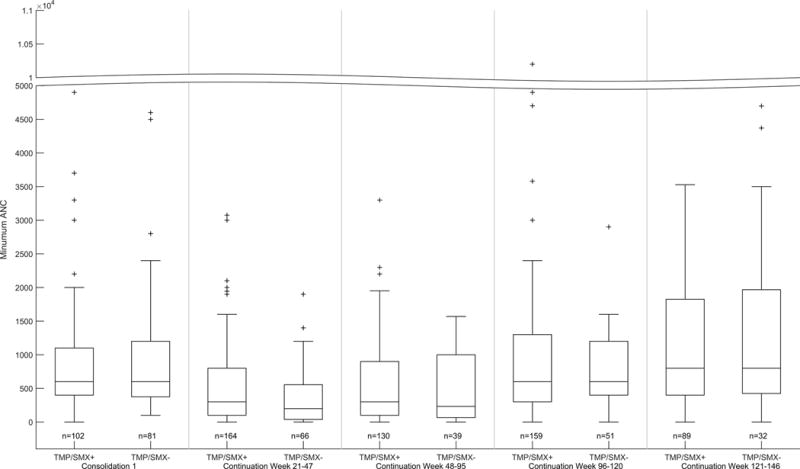
Figure 2. Lowest AUC subdivided by treatment phase and TMP/SMX status.

Boxplots of lowest ANC per phase during HDMTX on Total XVI (left panel, shown for consolidation #1 only) and for LDMTX on Total XV (right panels, shown for weeks 21–47, 48–95, 96–120, and 121–140). The bar, box, and whiskers represent the median, 25th-75th percentile, and non-outlier range respectively. n is the number of patients in each group.
