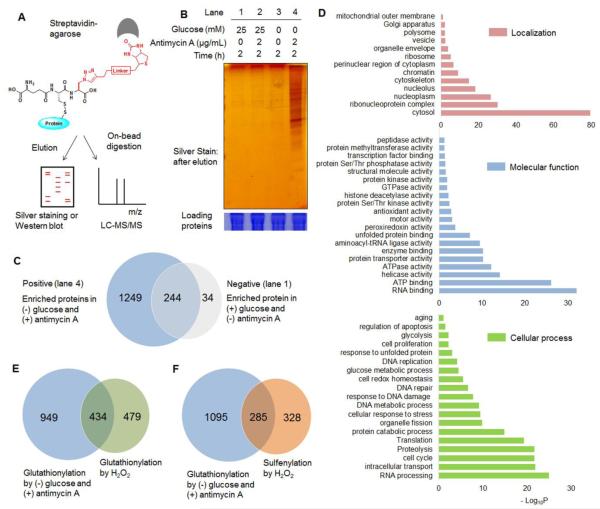
Fig. 4. Proteomic analysis of glutathionylated proteins.
(A) Approach for pull-down and mass analysis: after click reaction with biotin-alkyne, glutathionylated proteins enriched by streptavidin-agarose were eluted for silver staining or directly digested on-beads for LC-MS/MS analysis. (B) Analysis of enriched proteins in indicated conditions. (C) The number of glutathionylated proteins in indicated conditions by LC-MS/MS. ‘Positive’ and ‘negative’ indicate proteins enriched in lane 4 and 1, respectively, in Figure 4B. (D) DAVID gene ontology (GO) analysis of identified glutathionylated proteome. (E-F) Comparison of glutathionylated proteins in glucose starvation/antimycin A with previous proteomic data of glutathionylome (E) or sulfenylome (F) by treatment of exogenous H2O2.

