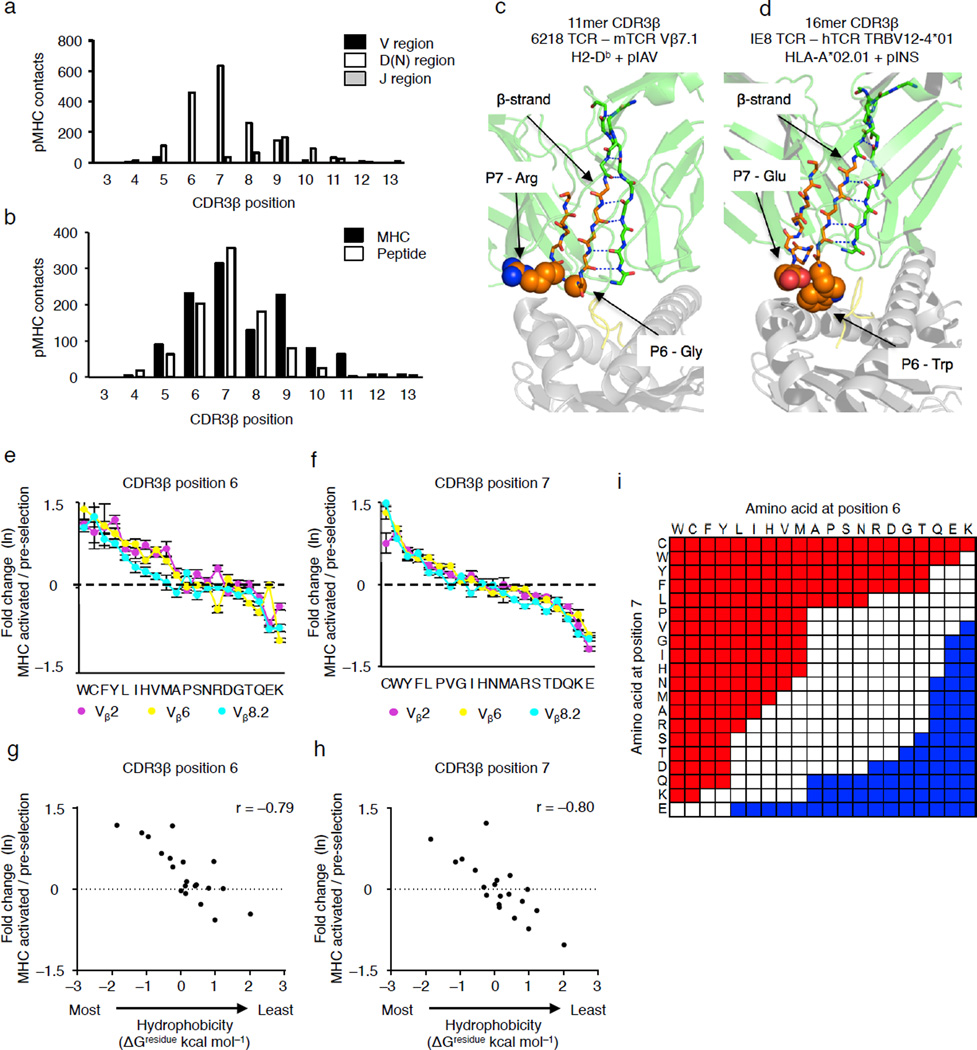
Figure 4.
Generation of a self-reactivity index based on the identity of the amino acid residues at CDR3β positions 6 and 7. (a,b) Summation of atom-atom contacts from 53 mouse and human TCR-pMHC complexes created by CDR3β residues, categorized by TCR: Vβ, Dβ-N and Jβ (a), or by MHC and peptide residues (b). (c,d) A β-strand places the CDR3β residues P6 and P7 (orange) within the TCR-pMHC interface, PDB:3PQY50 (c) and PDB:3UTS (d). (e,f) Rank order plots of the fold change in amino acid usage for Vβ2+ (purple), Vβ6+ (yellow) and Vβ8.2+ (cyan) pre-selection thymocytes expressing TCR with CDR3β of 13–15 amino acids long. The fold change is the ratio at which an amino acid is expressed in self-pMHC activated CD69+Nur77-GFP+ pre-selection thymocytes compared to unstimulated pre-selection thymocytes, with values plotted as the natural log (ln). (g,h) Scatter plot of CDR3β P6 and P7 fold change in usage and the interfacial hydrophobicity values (ΔGresidue kcal mol−1) of each amino acid. (i) Self-reactivity index, calculated by multiplying the fold change of single amino acid usage values, shown in e and f. CDR3β P6–7 doublets that promote self-reactivity (red) are defined as having a fold change > e0.4, doublets that limit self-reactivity (blue) are defined as having a fold change < e−0.35 (see Supplementary Fig. 3c). Spearman correlation coefficients, r, were calculated using GraphPad Prism software. Data are combined from three biological replicates (e–h) (e,f, mean ± s.e.m.).

