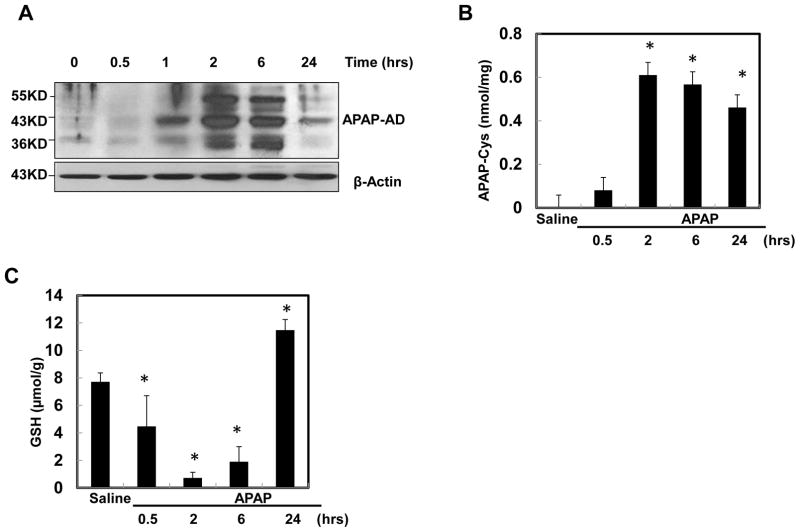
Figure 1. The dynamic change of APAP-AD levels in mouse livers.
Male C57BL/6J mice were treated with APAP (500 mg/kg) for different time points and pooled liver lysates from 3–4 mice of each group were subjected to western blot analysis (A) or HPLC-ED analysis (B) for APAP-AD (means ± SE, n=3–4). (C) Mice were treated as in (A) and total hepatic GSH contents were determined and data are presented as means ± SE (n=3–5). * P<0.05. One way anova analysis with Scheffé’s post hoc test.

