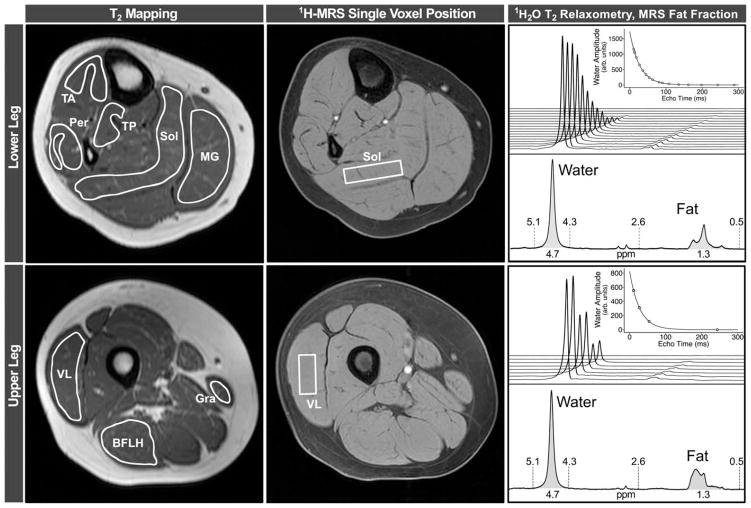
FIGURE 1.
Raw data from an unaffected control subject, illustrating data analysis. For MRI-T2 mapping analysis, regions of interest were outlined on eight leg muscles on the image acquired with a TE of 20 ms. To avoid contamination from subcutaneous fat, bone, or other tissue, boundaries were traced slightly inside of the muscle boundaries. Rectangular 1H-MRS voxels were selected in the Sol and VL muscles, and used to measure both 1H20T2, by fitting water peak height to a monoexponential curve, and FF, by integrating the water and lipid peaks. BFLH=long head of the biceps femoris; GRA=gracilis; 1H-MRS=proton magnetic resonance spectroscopy; MG=medial gastrocnemius; MRI=magnetic resonance imaging; MRS=magnetic resonance spectroscopy; PER=peroneals; SOL=soleus; TA=tibialis anterior; TE=echo time; TP=tibialis posterior; VL=vastus lateralis.

