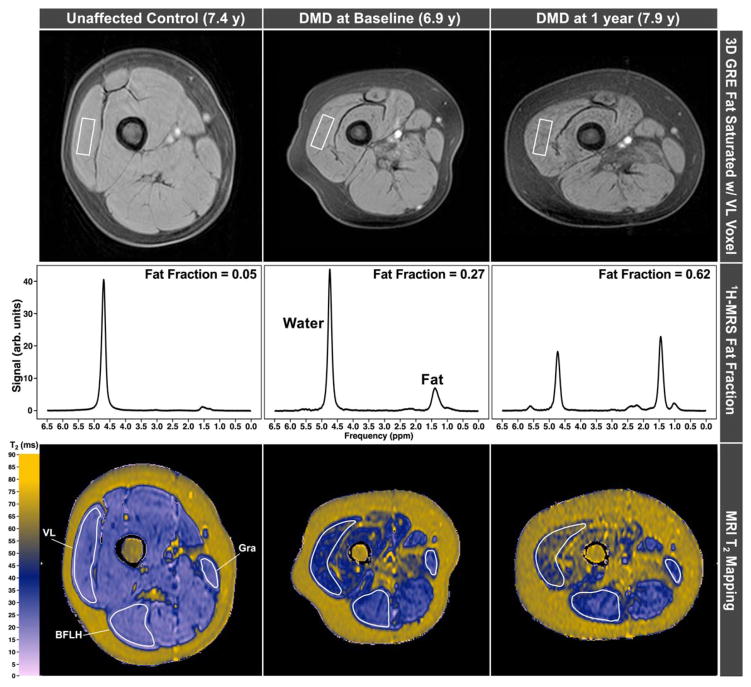
FIGURE 3.
3D gradient echo images acquired in the upper leg of an unaffected control subject and a boy with DMD at baseline and 12-month follow-up time points show increases in intramuscular fat (top). Spectra show the quantitative increase in fat, whereas MRI-T2 maps show increased T2 concomitant with increased fat fraction. 3D=three-dimensional; BFLH=long head of the biceps femoris; DMD=Duchenne muscular dystrophy; BFLH=long head of the biceps femoris; GRA=gracilis; GRE=gradient refocused echo; 1H-MRS=proton magnetic resonance spectroscopy; MRI=magnetic resonance imaging; VL=vastus lateralis.

