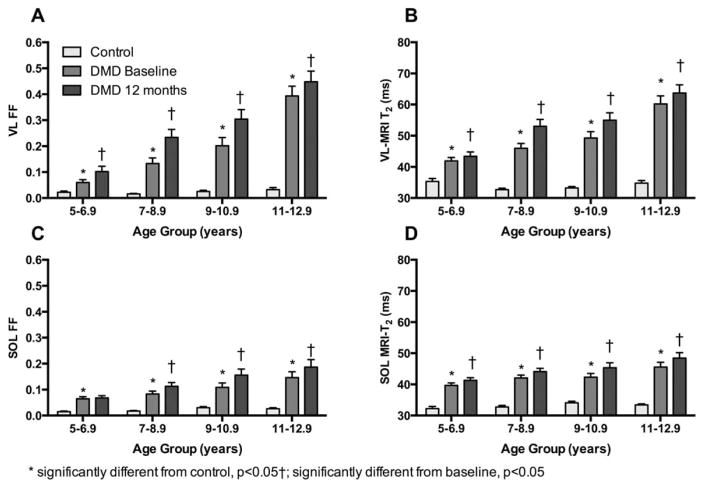
FIGURE 5.
FF and MRI-T2 in the SOL and VL muscle were greater in DMD than control at all ages and were higher at 12 months than baseline. This increase was significant in all groups except SOL FF in 5- to 6.9-year-old boys. Data are presented as mean±standard error. DMD=Duchenne muscular dystrophy; FF=fat fraction; MRI=magnetic resonance imaging; SOL-=soleus; VL=vastus lateralis.

