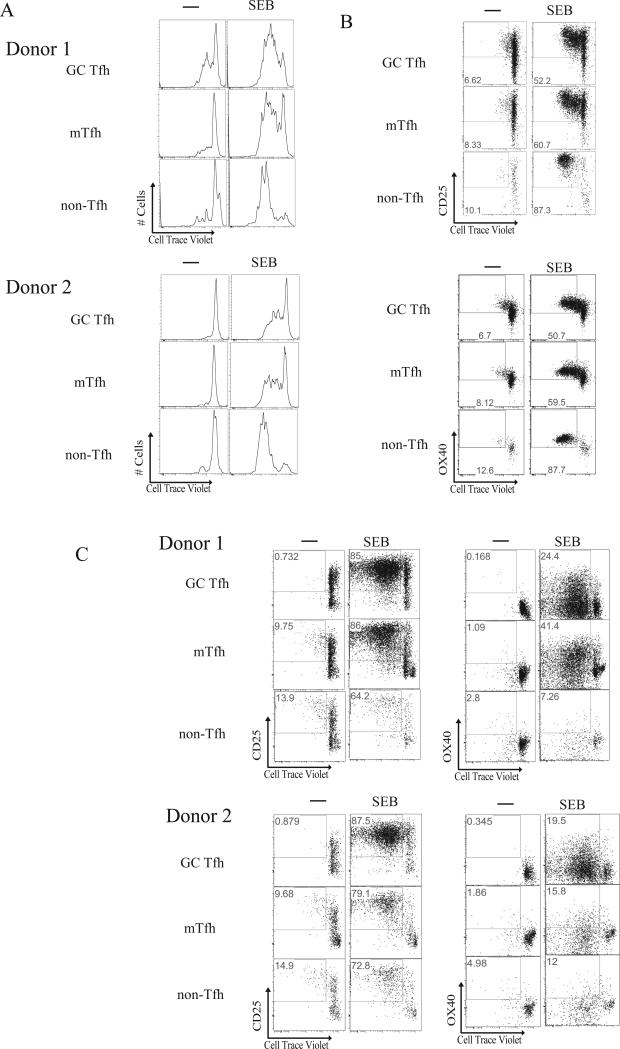
FIGURE 2.
Proliferation of GC Tfh cells upon restimulation. (A) Representative histograms of proliferating GC Tfh, mTfh, and non-Tfh cells from 2 different tonsils following stimulation of whole tonsil cells with 100ng/mL Staphylococcal enterotoxin B (SEB). (B) Representative flow cytometry plots of proliferating GC Tfh, mTfh, and non-Tfh cells from a donor following stimulation of whole tonsil cells with 100ng/mL SEB. Cells were gated on CTV+CD25+ or CTV+OX40+. Data are representative of a total of 11 samples from 2 independent experiments. (C) Representative flow cytometry plots of sorted GC Tfh (live CXCR5hiPD-1hiCD45RA−CD4+), mTfh (CXCR5+PD-1+CD45RA−CD4+), and non-Tfh cells (CXCR5−CD45RA−CD4+) from 3 different tonsils. Cells were co-cultured with autologous irradiated EBV-transformed lymphoblastoid cell lines for 96 hours, stimulated with 100ng/mL SEB, and analyzed for CTV+CD25+ or CTV+OX40+ expression. FACS plots show only 20% of collected events, for easier visualization. Data are representative of a total of 21 samples from 6 independent experiments.

