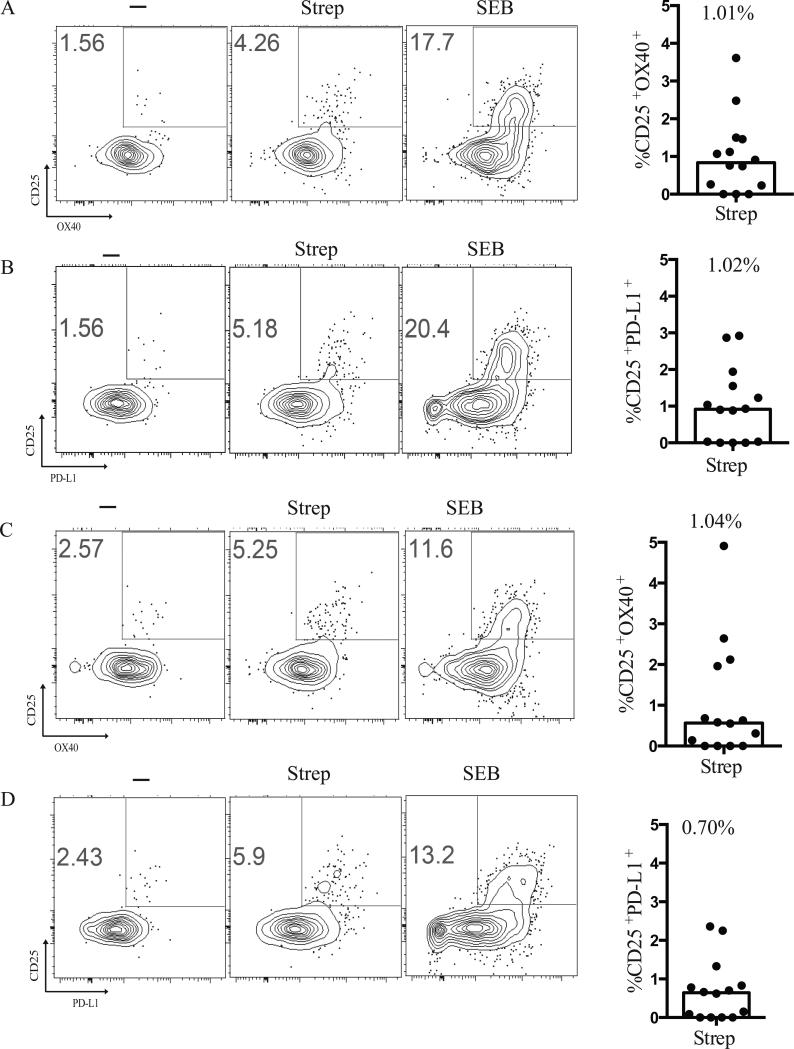
FIGURE 4.
Activation Induced Marker induction by mTfh and non-Tfh cells. (A) Representative flow cytometry plots of CD25+OX40+ upregulation by live mTfh (CXCR5+PD-1+CD45RA−CD4+) following stimulation with Strep or 1μg/mL SEB. Median CD25+OX40+ expression by live mTfh following stimulation with Strep. Responses were background subtracted. Data are from 14 samples from 2 independent experiments. The response by antigen-specific cells was background subtracted for each donor. (B) Representative flow cytometry plots of and CD25+PD-L1+ upregulation by live mTfh (CXCR5+PD-1+CD45RA−CD4+) following stimulation with Strep or 1μg/mL SEB. Median CD25+PD-L1+ expression by live mTfh following stimulation with Strep. Responses were background subtracted. Data are from 14 samples from 2 independent experiments. The response by antigen-specific cells was background subtracted for each donor. (C) Representative flow cytometry plots of CD25+OX40+ upregulation by non-Tfh cells (CXCR5−CD45RA−CD4+). Median CD25+OX40+ expression by live non-Tfh following stimulation with Strep. Responses were background subtracted. Data are from 14 samples from 2 independent experiments. The response by antigen-specific cells was background subtracted for each donor. (D). Representative flow cytometry plots of CD25+PDL1+ upregulation by non-Tfh cells (CXCR5−CD45RA−CD4+). Median CD25+PD-L1+ expression by live non-Tfh following stimulation with Strep. Responses were background subtracted. Data are from 14 samples from 2 independent experiments. The response by antigen-specific cells was background subtracted for each donor.

