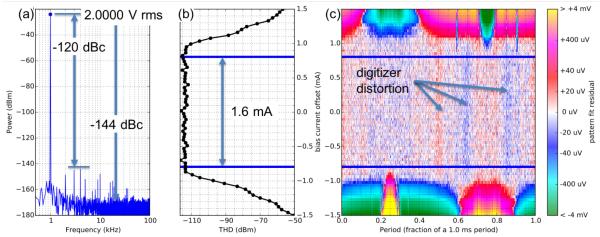
Fig. 4.
Digitally sampled spectral measurement (a) showing a low distortion JAWS output voltage with an rms magnitude of 2 V. The digitizer was set to its 10 V range with a 1 MΩ input impedance and a 1 MS/s sampling rate. There is a +/− 0.75 mA dither current applied during the 40 ms of data used to generate the FFT, that is, between the blue lines in (b) and (c) that indicate the JAWS operating current range. In (b) we plot THD versus dither offset current showing the 1.6 mA operating current range. In (c) we plot the same data as in (b) so as to show the voltage residuals of a fit to a sinusoid (color) versus dither offset current (y-axis) and waveform period (x-axis) which highlights the pulse sequences at 0.25, 0.6, and 0.9 periods that limit the operating current range.

