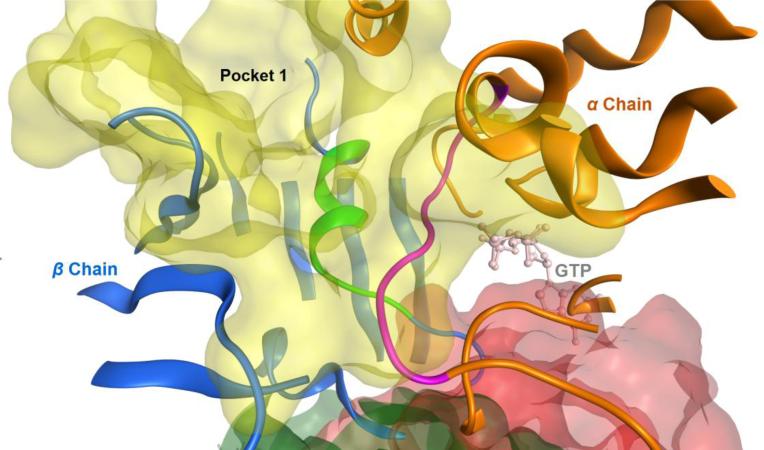
Figure 7.
The close up view of pocket 1, the predicted putative binding site. The loop of residues from 96 to 103 on the α chain is shown in the purple ribbon and the loop of residues from 251 to 263 on the β chain is shown in the green ribbon. The GTP molecule at the N site is also included as a light pink stick model.

