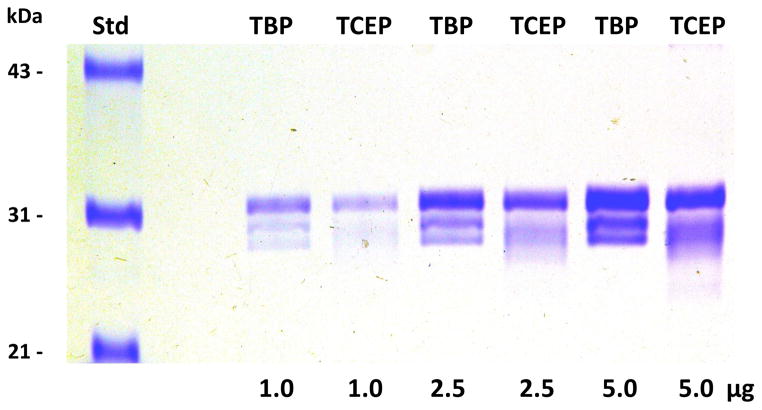
Figure 2. Comparison of cell line 85 h2E2 mAb samples prepared following the protocol outlined in Figure 1 using TBP or TCEP as the reductant.
Cell line 85 mAb samples were prepared for mass spectral analyses, either using the protocol delineated in Figure 1, or using a modification of the Figure 1 protocol with TCEP replacing TBP as the reductant. Multiple aliquots of the resulting samples were analyzed by 10% SDS-PAGE, without DTT reduction prior to electrophoresis. The gel was subsequently stained with Coomassie blue.

