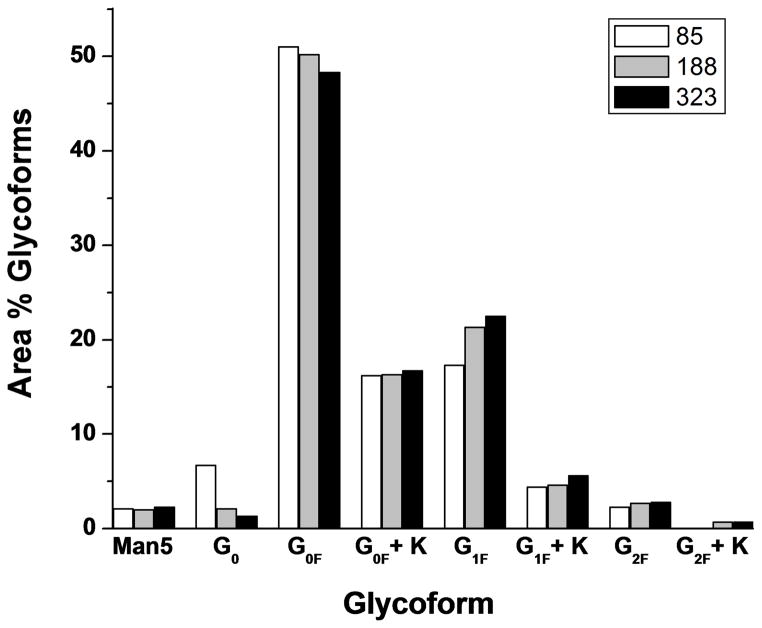
Figure 4. Comparison of the glycoform distributions of the 3 cell lines of the h2E2 anti-cocaine mAb.
The glycoform peak areas for each of the 3 cell lines from Figure 3 were captured and plotted as area percentages of the total identified glycoforms, as described in the Methods section. White bars – cell line 85; grey bars – cell line 188; black bars – cell line 323.

