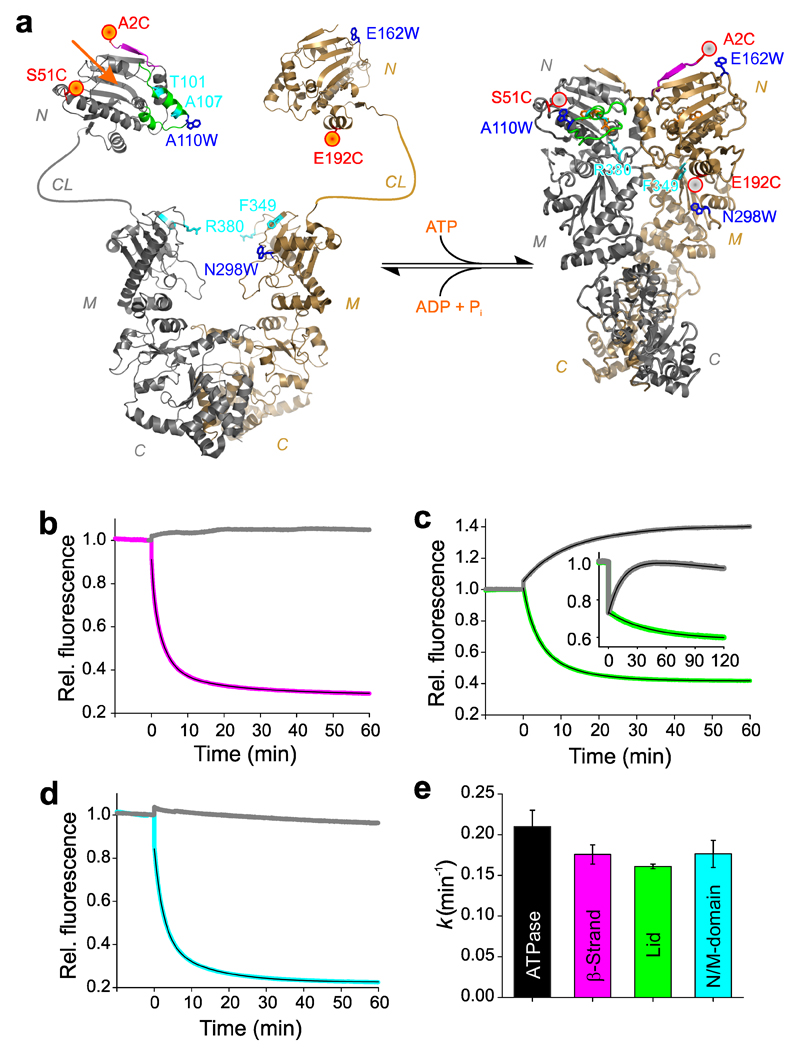
Figure 1. Observation of conformational motions in Hsp90 by PET fluorescence quenching.
(a) PET reporter design. Left: Structural model of apo Hsp90 based on crystallographic data of the NTD (pdb id 1AM1) and the MC-domain (pdb id 2CGE). NTD (N), charged linker (CL), M-domain (M), and C-domain (C) are indicated. The nucleotide-binding pocket is indicated by an orange arrow. Right: Crystal structure of full-length Hsp90 in closed-clamp conformation with bound AMP-PNP (pdb id 2CG9). N-terminal β-strand and lid are colored magenta and green, respectively. Engineered Oxa and Trp are shown as red spheres and blue sticks, respectively. Amino acid side chains that were mutated to alter function are highlighted in cyan. (b) Fluorescence intensity time traces of reporter A2C-E162W for β-strand swap (magenta) and the corresponding control A2C (gray). AMP-PNP was added at t = 0 min. The black line is a three-exponential fit to the data. (c) Fluorescence intensity time traces of reporter S51C-A110W for lid closure (green) fitted using a bi-exponential function, and of variant S51W-A110C (inset, green). Controls S51C and A110C are shown in gray. (d) Fluorescence intensity time traces of reporter E192C-N298W for N/M-association (cyan) fitted using a bi-exponential function. Control E192C is shown in gray. (e) ATPase activity of wild-type Hsp90 and mean rate constants of β-strand swap, lid closure, and N/M-domain association obtained from PET fluorescence experiments. Data represent mean values ± s.d. of three measurements.

