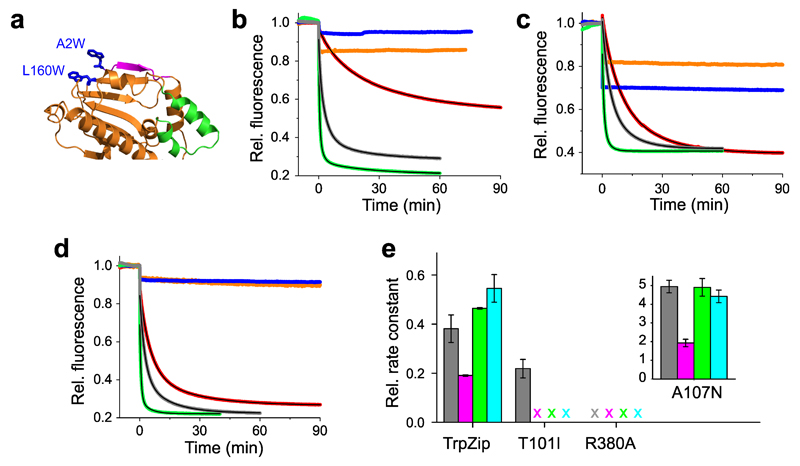
Figure 2. Modulation of conformational motions by mutagenesis.
(a) Crystal structure of the NTD (pdb id 1AM1) showing the engineered TrpZip motif introduced through double mutation A2W-L160W (blue sticks). N-terminal β-strand and lid segment are highlighted magenta and green. (b) Time-dependent fluorescence intensities of reporter A2C-E162W (β-strand swap) and mutants thereof. Fluorescence time traces of wild-type (gray), TrpZip (red), mutants T101I (orange), R380A (blue), and A107N (green) are shown. Black lines are exponential fits to the data. AMP-PNP was added at t = 0 min. (c) Time-dependent fluorescence intensities of reporter S51C-A110W (lid) and mutants thereof. The color code of panel (b) applies. (d) Time-dependent fluorescence intensities of reporter E192C-N298W (N/M-domain association) and mutants thereof. The color code of panel (b) applies. (e) Effects of mutation on the rate constant of ATP hydrolysis by Hsp90 (gray) and on the mean rate constants of β-strand swap (magenta), lid closure (green), and N/M-domain association (cyan). ATPase activities of de-activating mutants (TrpZip, T101I, and R380A) were measured at 37° C and plotted as relative rate constants. Data represent mean values ± s.d. of three measurements. X = no kinetics detectable.

