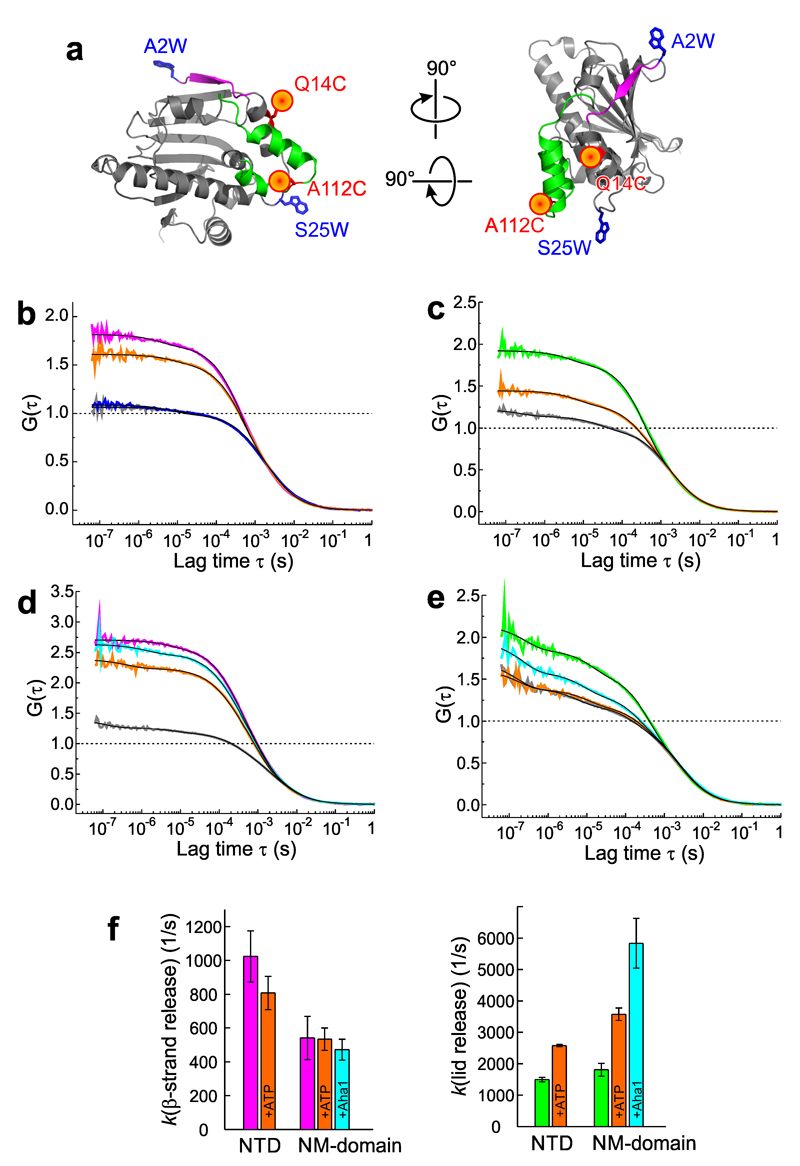
Figure 4. Equilibrium dynamics of lid and β-strand probed by PET-FCS.
(a) Reporter design. N-terminal β-strand and lid of the NTD (pdb id 1AM1) are highlighted magenta and green. Engineered pairs of Oxa (red sphere) and Trp (blue sticks) probing β-strand (Q14C-A2W) and lid (A112C-S25W) are indicated. (b) and (c), ACFs (G(τ)) recorded from Q14C-A2W (magenta) and A112C-S25W (green), respectively, on the isolated NTD. Data recorded after binding of ATP are shown in orange. Control samples lacking the engineered Trp are shown in gray. Black lines are fits to the data using a model for molecular diffusion containing two single-exponential relaxations. The ACF of the TrpZip construct (Q14C-A2W-L60W) is shown in blue in panel (b), and was described by a molecular diffusion model without additional relaxations. All ACFs were normalized to the average number of molecules in the detection focus for clarity. Broken lines indicate the amplitudes of the diffusion decays. (d) and (e) ACFs of same reporters engineered on the NM-domain. Same color code as in panels (b) and (c) applies. Black lines are fits to the data using a model for molecular diffusion containing three single-exponential relaxations. ACFs recorded in the presence of Aha1 are shown in cyan. (f) Rate constants of β-strand release (magenta) and lid release (green) in NTD and NM-domain. Effects of binding of ATP and Aha1 are shown. Data represent mean values ± s.d. of three measurements.

