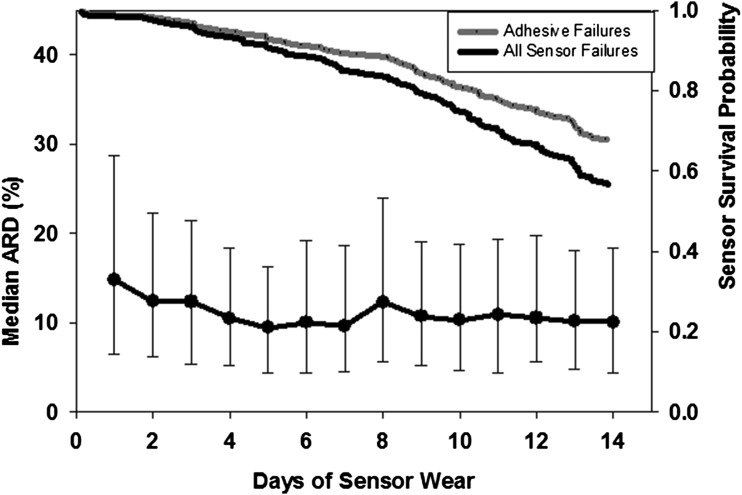
Figure 1.
The left y-axis shows the MARD of sensor readings for each day of wear (black circle) with IQR. The right y-axis shows the portion of sensors functioning on each day of wear, with the gray line representing sensor loss related to adhesive failures and the black line representing all sensor failures.

