
Exhibit 1. Total US expenditures for opioid pain relievers, by insurance type and year.
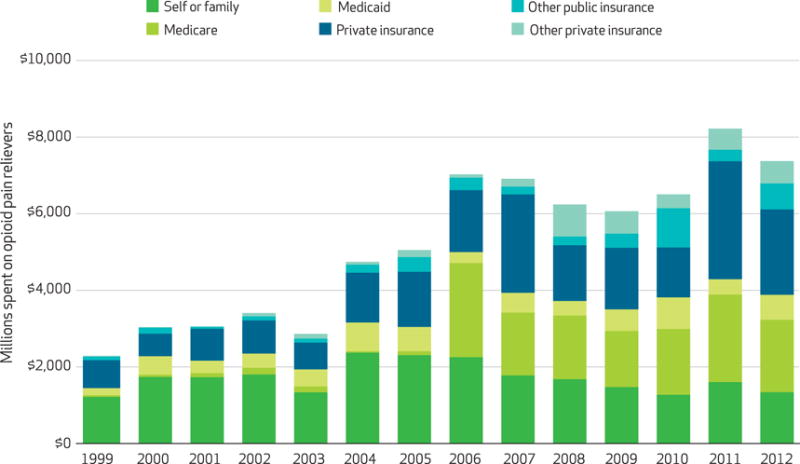
SOURCE Authors’ analysis. NOTES Expenditures were adjusted by the Medical Expenditure Panel Survey’s pharmaceutical price index, which used 2009 as the base year. The categories of insurance are explained in the text. The overall upward trend in total spending during the study period in Medicare, Medicaid, and private insurance (but not self-pay) was significant (p < 0.001). The larger changes between years, such as between 2010 and 2011 for private insurance (p < 0.01) and between 2006 and 2007 for Medicare (p < 0.05), were also significant, but some of the smaller changes were not. We used Change-Point Analyzer Software to identify changes in trends for spending. For Medicare, private insurance, and total spending, there was such a change in 2006 (99% confidence level). For self or family, there was such a change in 2004 (96% CI).