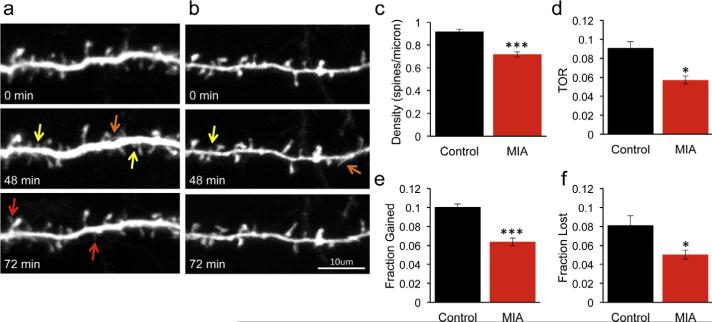
Fig. 2.
Reduced density and dynamics of dendritic spines in MIA offspring. Multiphoton imaging of cortical neurons from P17 YFP-H mice through a thinned skull window in control (a) and MIA (b) offspring. Images were collected every 12 min for a period of 1.5 h. Note the reduced density of dendritic protrusions in the MIA offspring. Dendritic spine formation (red arrows) and elimination (yellow arrows) is prevalent in control but not MIA offspring. Spines that appear but then disappear are marked with an orange arrow. (c–f) Quantification of spine parameters imaged in vivo in 5 mice for each condition (multiple t-tests with Bonferroni corrections). Spine density is reduced in MIA offspring (control: 0.92 ± 0.02 spines/micron; MIA: 0.72 ± 0.02 spines/micron, P = 0.0001). Turnover rate (TOR) is reduced in MIA offspring (control: 0.091 ± 0.01; MIA 0.057 ± 0.004, P = 0.013) due to reduction in both fraction of spines gained (control: 0.1 ± 0.003; MIA: 0.064 ± 0.004, P < 0.0001) and fraction of spines lost (control: 0.08 ± 0.01; MIA: 0.05 ± 0.005, P = 0.028). Data are represented as mean ± SEM. (For interpretation of the references to color in this figure legend, the reader is referred to the web version of this article.)

