
Figure 3.
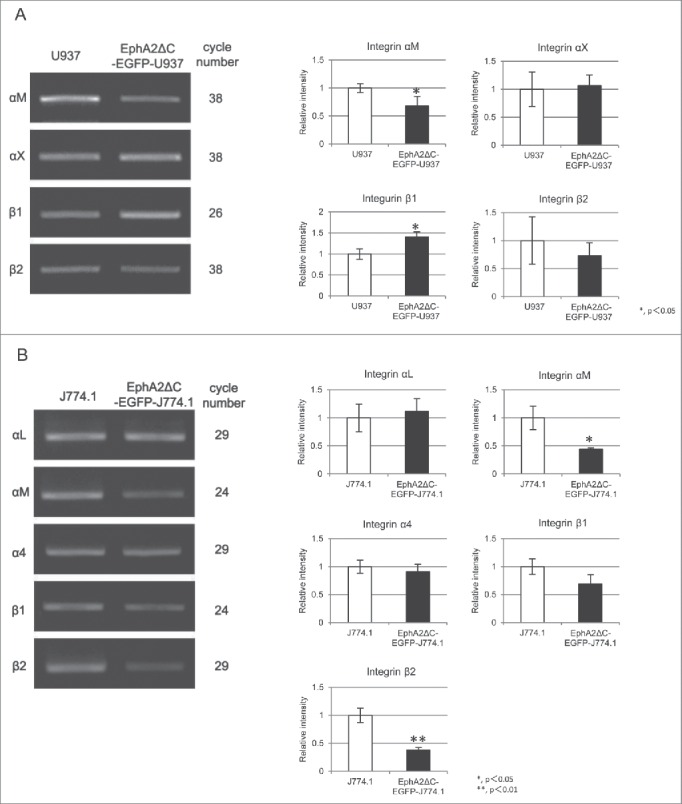
RT-PCR amplification and densitometric quantification of αM, αX, β1, and β2 integrin subunit expression in U937 and EphA2ΔC-EGFP-U937 cells (A), along with that of αL, αM, α4, β1, and β2 in J774.1 and EphA2ΔC-EGFP-J774.1 cells (B). Data from 3 independent experiments, normalized to GAPDH, are shown as mean ± SD. *P< 0.05, **P < 0.01.