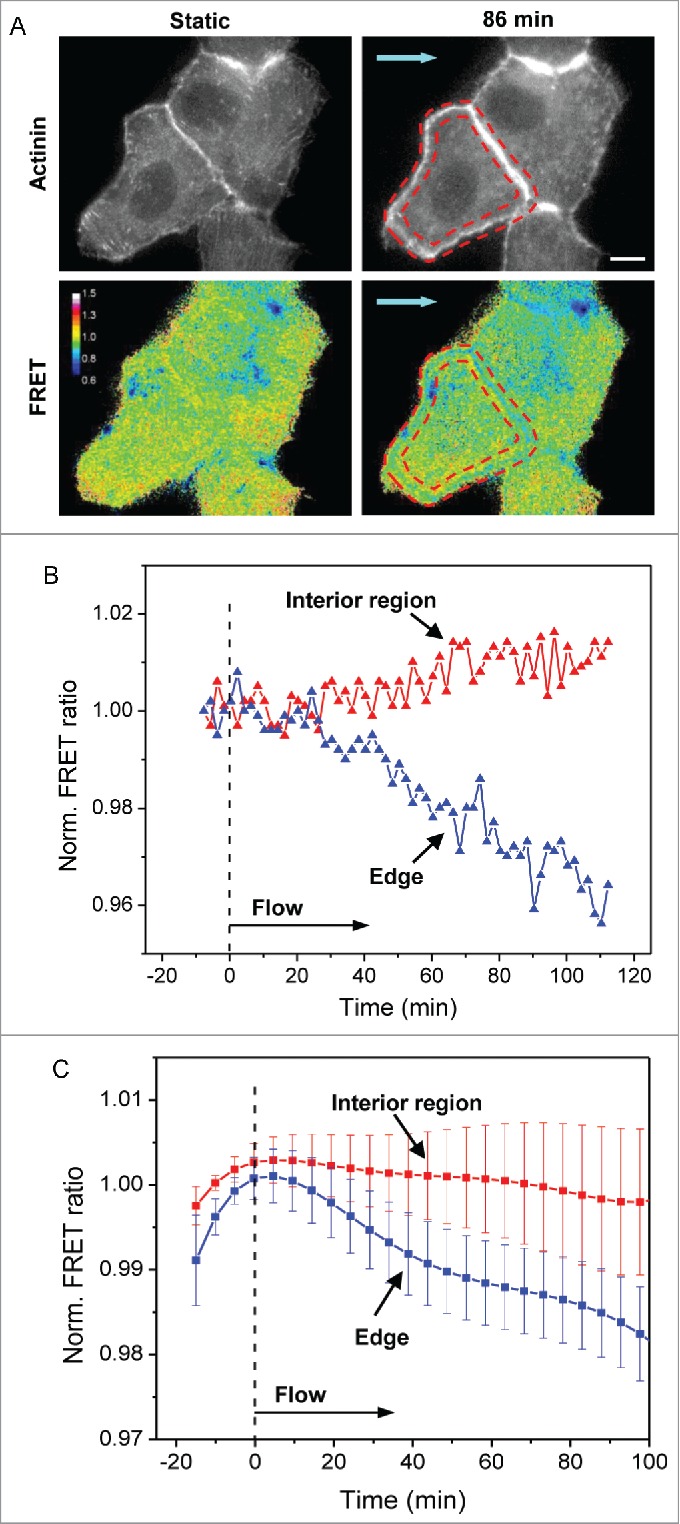
Figure 2.

Redistribution of cytoskeletal tension under shear stress. (A) Images of actinin-sstFRET (YFP channel, indicating F-actin) (upper panel) and FRET ratio in color map (lower panel) of cells in static condition and after 86 min of shear stress. The cool colors (blue) in FRET ratio images indicate higher tension whereas warm colors (red) indicate lower tension. The cell periphery is marked by the red-dash outlines, showing a higher actin density and tension under shear. Blue arrows indicate the direction of flow. (B) Time course of the FRET ratio in the interior region of the cell (red curve) and at the cell edges (blue curve) for the cell shown in (A), showing that the tension in the interior region decreases, whereas the tension at the cell edges increases under flow. (C) Time dependent changes in interior and edge tension under flow averaged over multiple cells (n = 7). The error bars indicate s.e.m. Scale bar = 10 μm.
